Lab 1 - ECE 421L
Authored
by Kolby Tran,
Email: trank19@unlv.nevada.edu
Pre-lab work
- The lab reports will be drafted using html and placed on CMOSedu.
- Prior
to the first day of lab, but no earlier than one week before the lab
starts, get a CMOSedu account, using your UNLV email address, from Dr.
Baker, rjacobbaker@gmail.com
- Review the material seen here covering editing webpages (do this before the first lab)
Lab description
This first lab will go through the first part of Tutorial 1 seen here.
Use an Xterm (written and video) as discussed.
Lab Work: Tutorial 1
After logging in and setting up all the necesary files through MobaXterm we are able the start using Cadence’s
Virtuoso editing tool. We type "cd CMOSedu" in the command line to
change the directory from home to CMOSedu. After which we type
"virtuoso &" in the command line. to open Cadence. 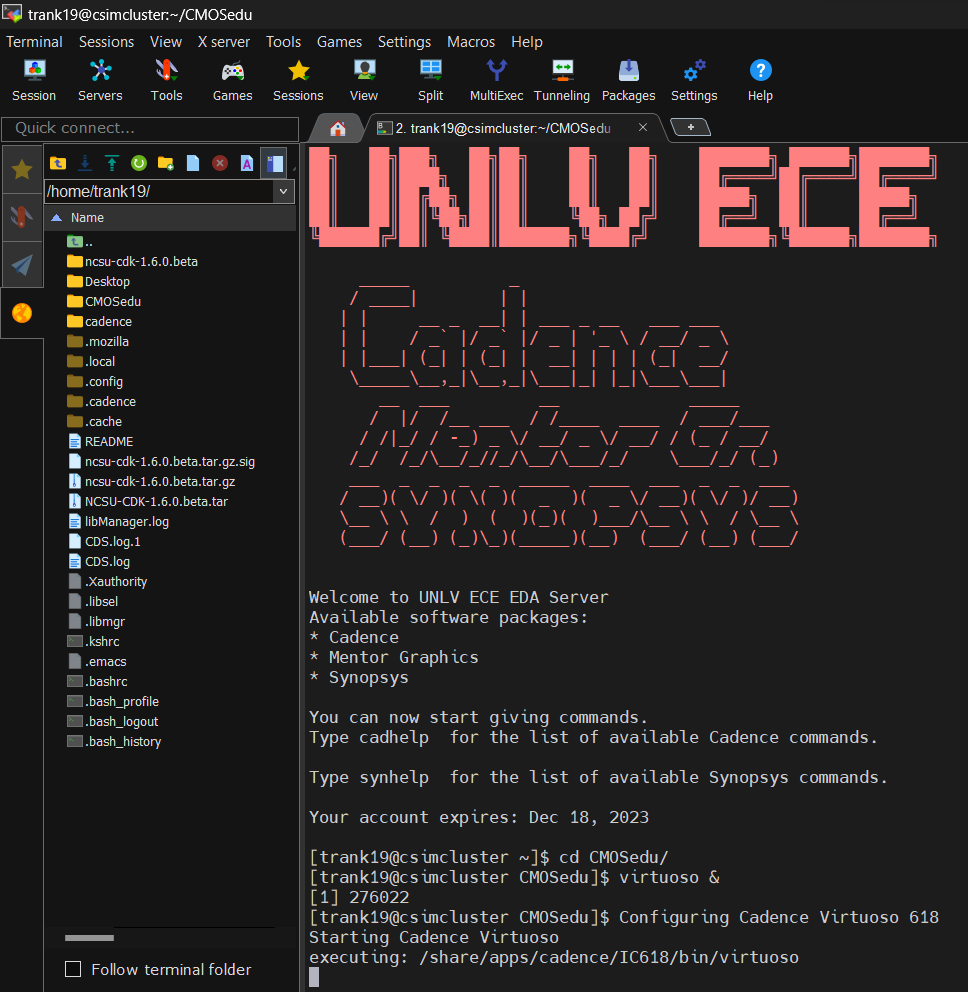
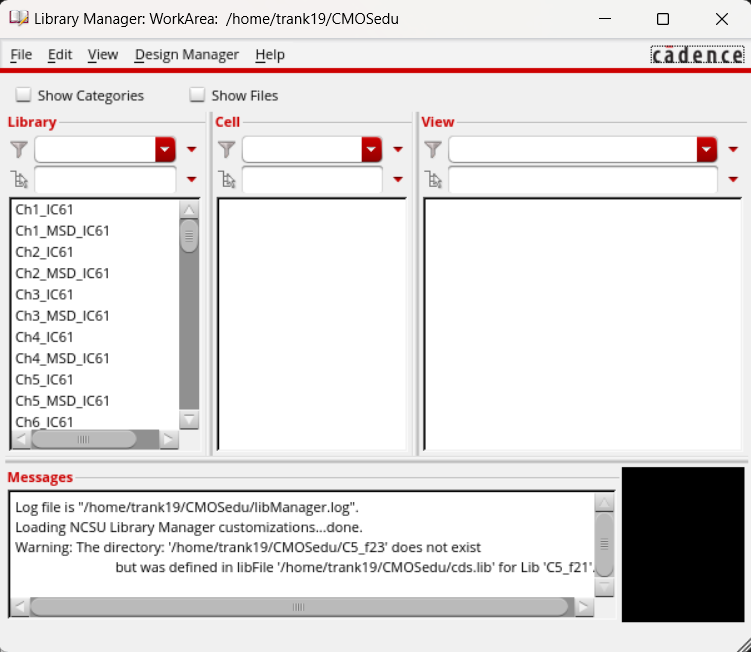
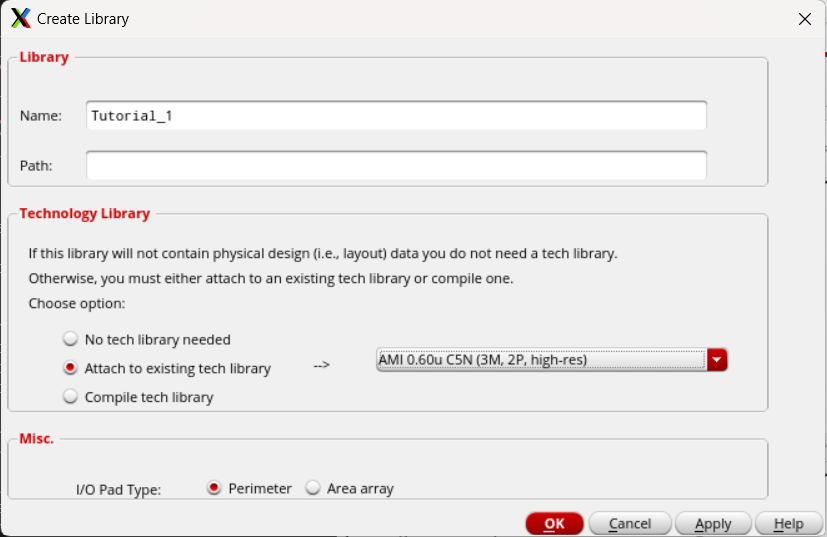
After
launching Cadence, we create a new library in the Library Manager
through File -> New -> Library and name it
"Tutorial_1". "AMI 0.60u C5N (3M, 2P, high-res)" is selected under
the Technology Library.
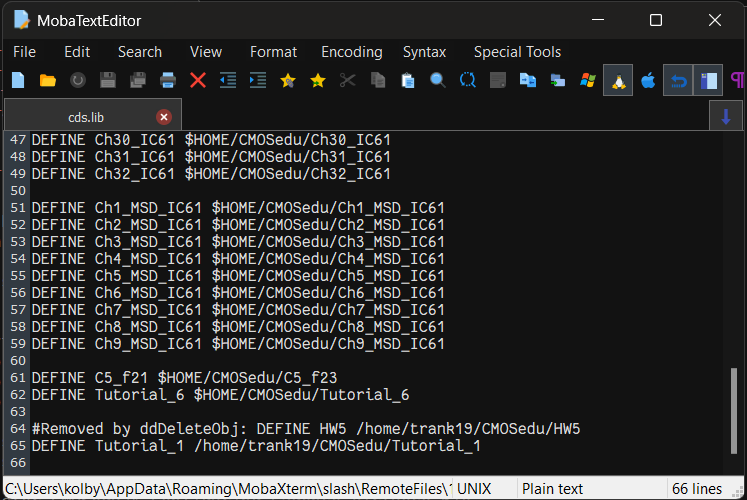
"Tutorial_1" is now defined in the cds.lib
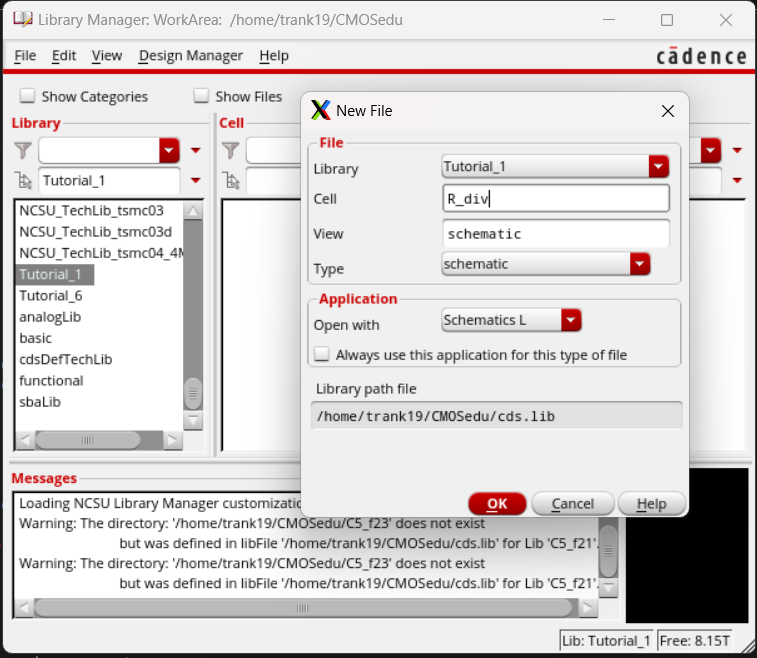
With
"Tutorial_1" selcted in the Library Manager, we create a new cell view
named "R_div" in the menu through File -> New -> Cell View.
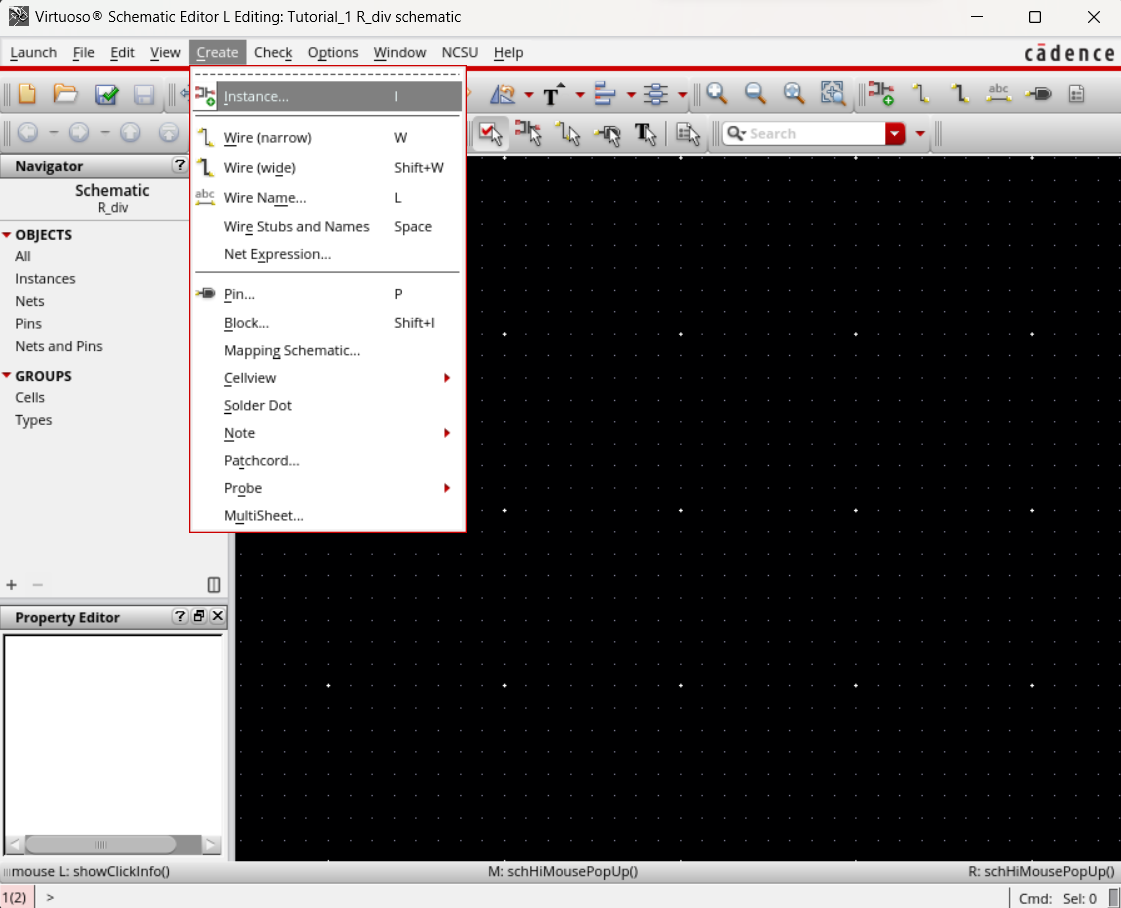
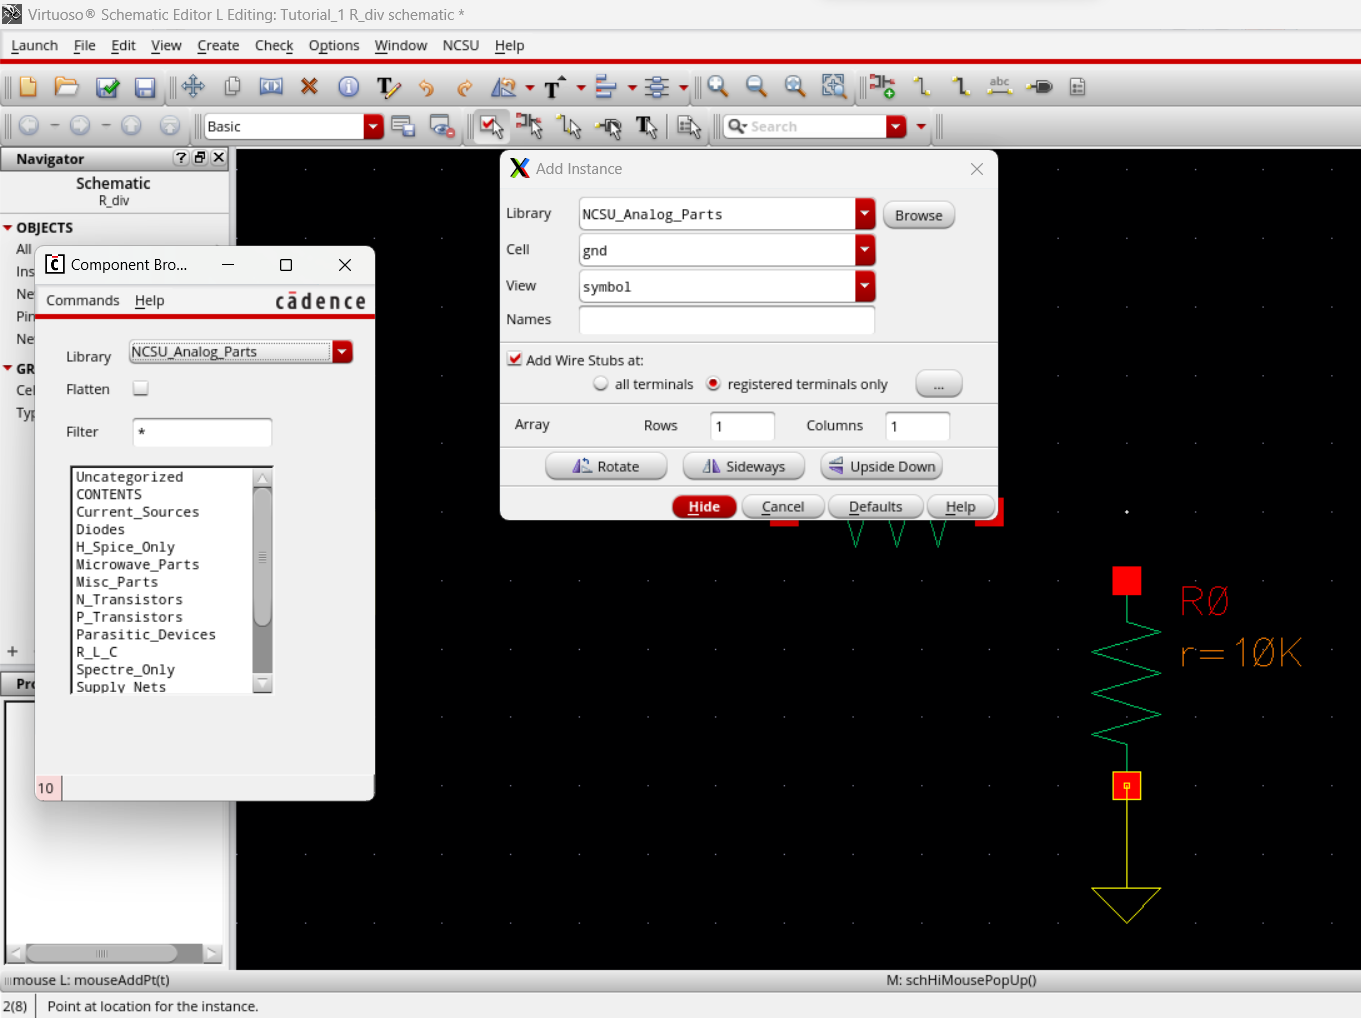
Now we can create an instance either through Create -> Instance or by using the keyboard shortcut "I".
From the NCSU_Analog_Parts library, we select a resistor and set its value to 10K ohms.
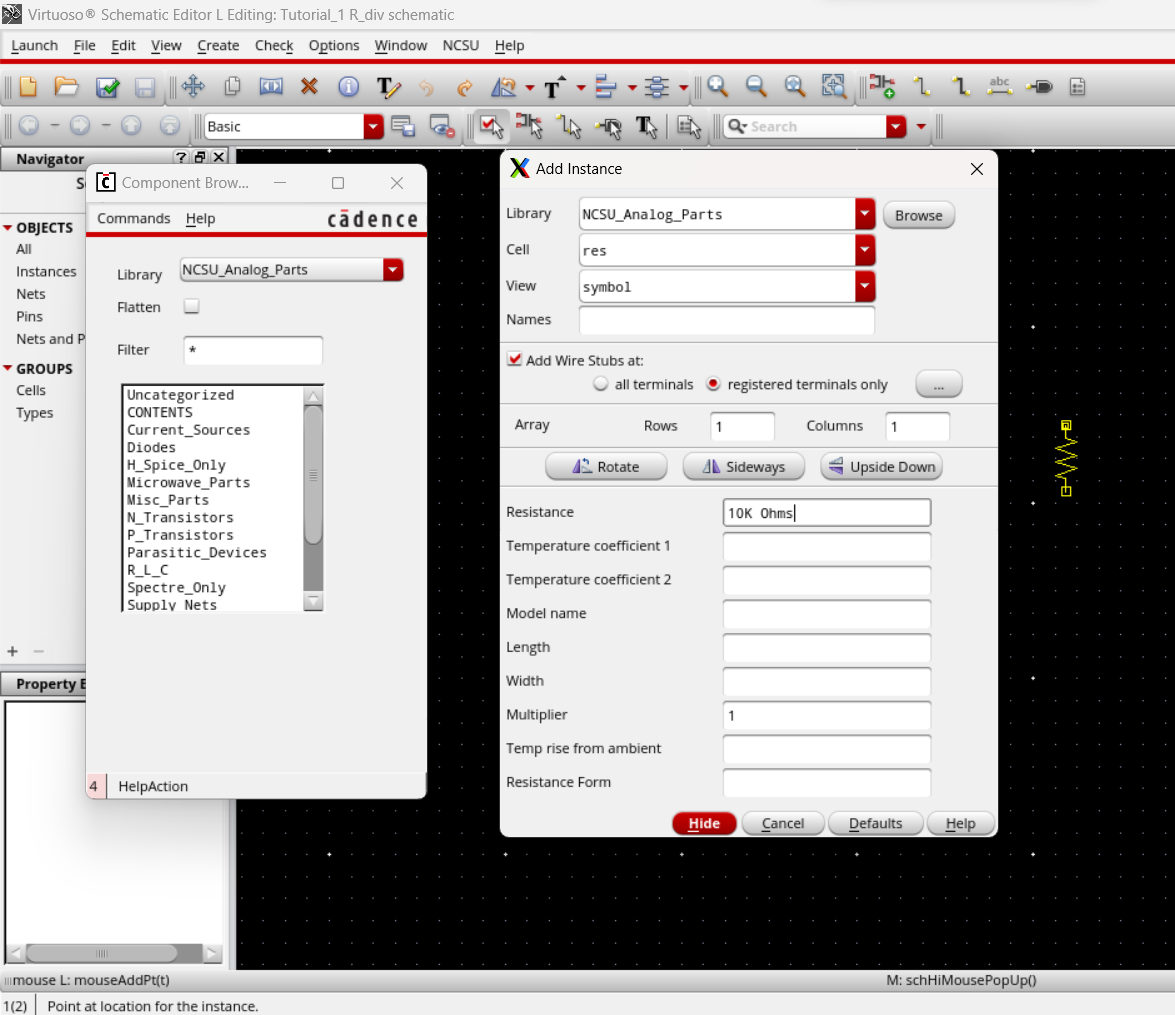
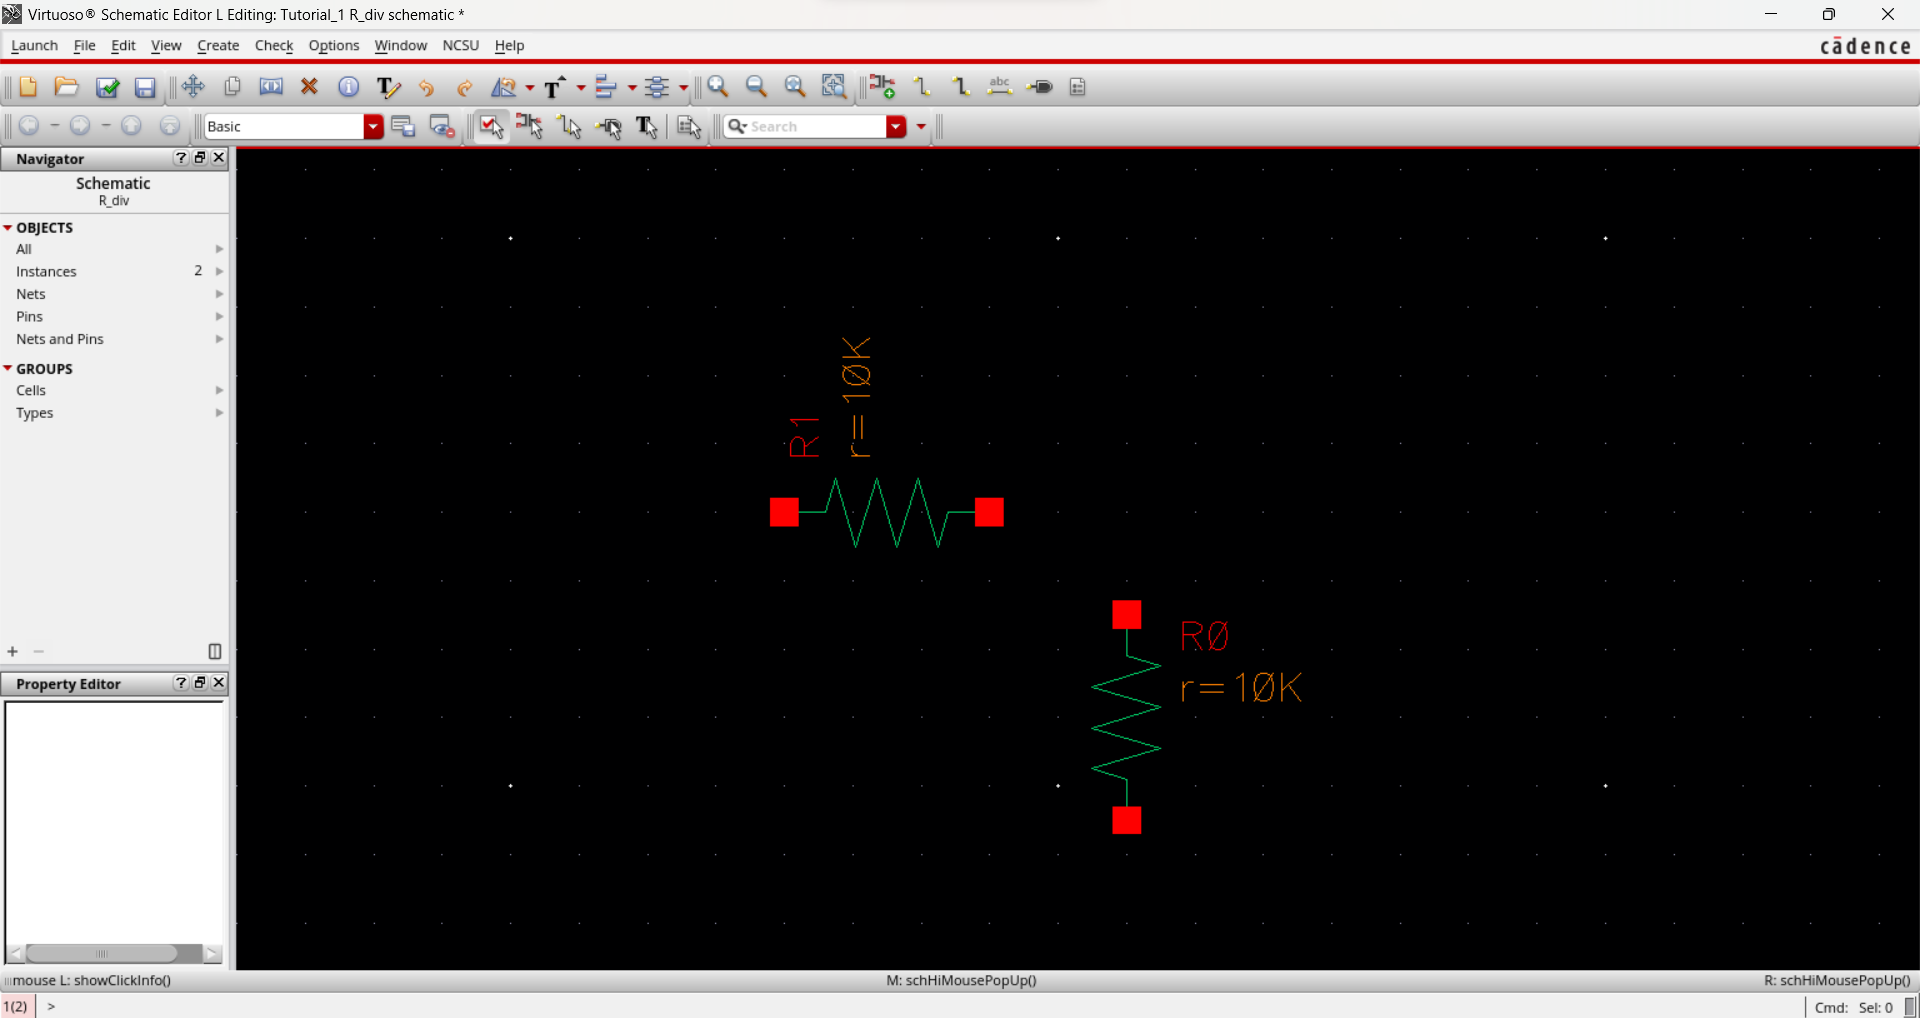
After which we select and place down 2 resistors.
We create another instance to select and place down a ground.
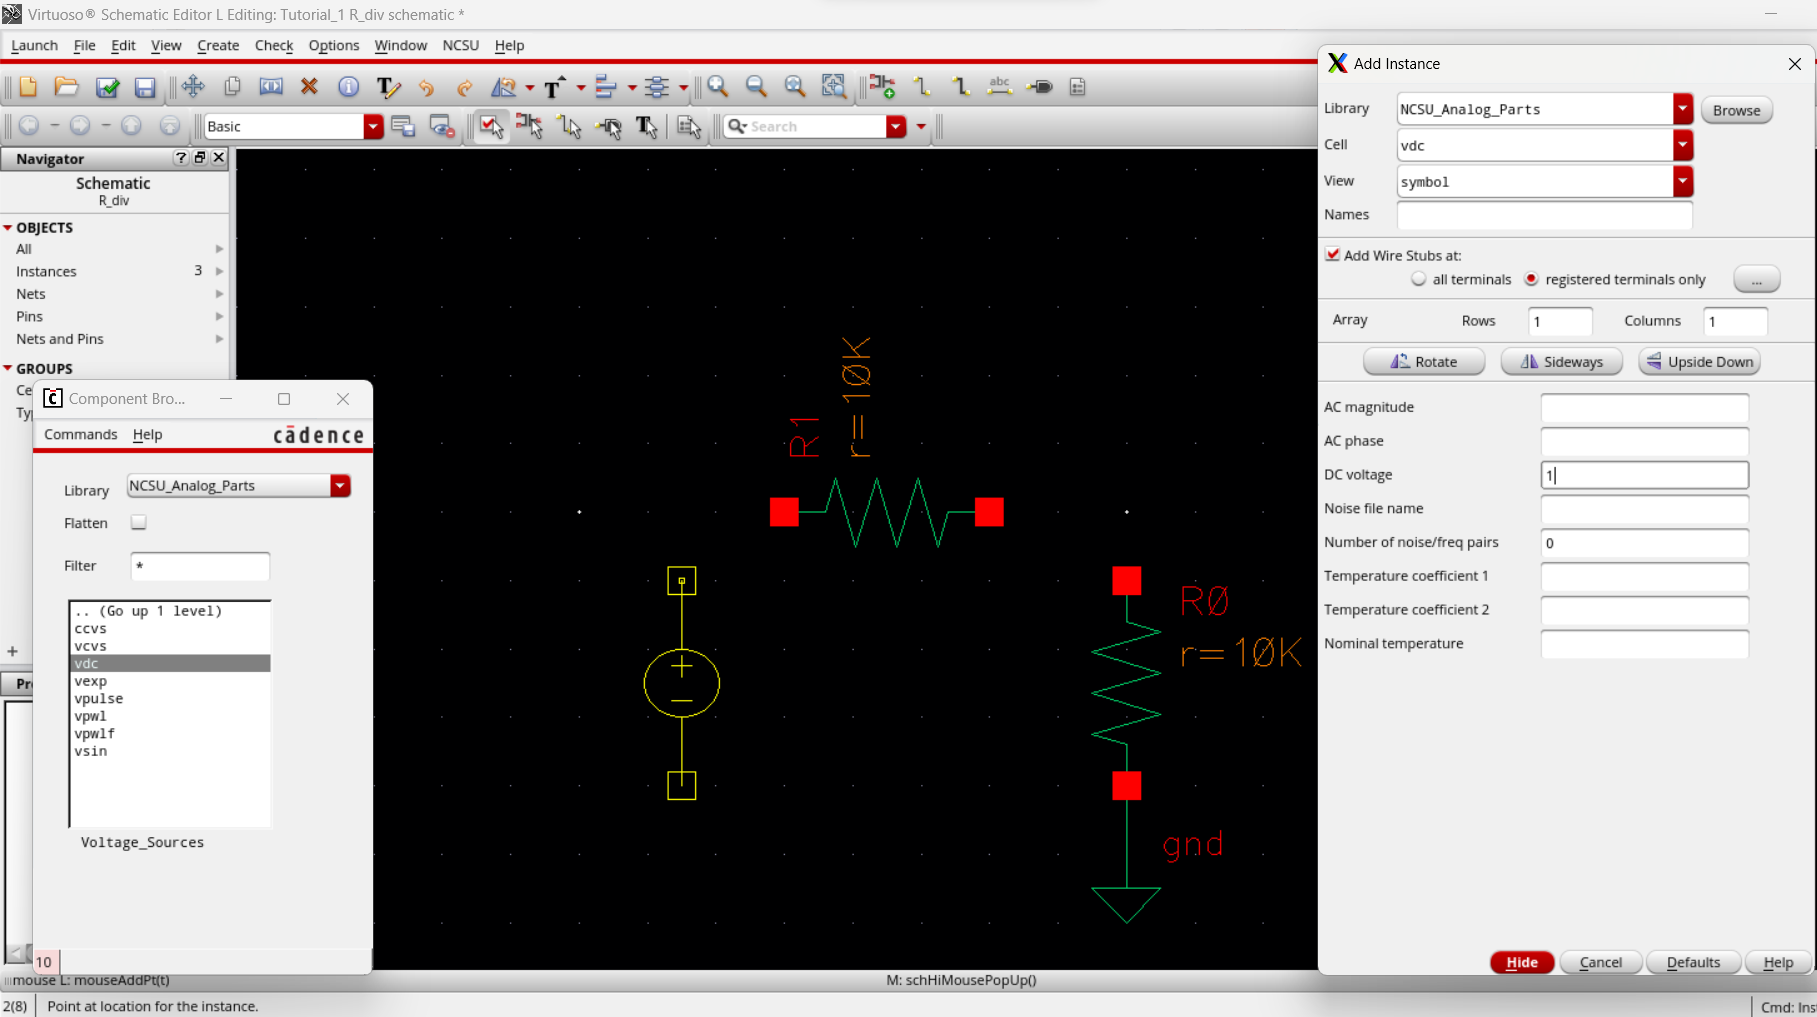
Another instance is created for a voltage source and set it to 1 volt DC.
Using the keyboard shortcut "W", we wire together the components to complete the circuit.
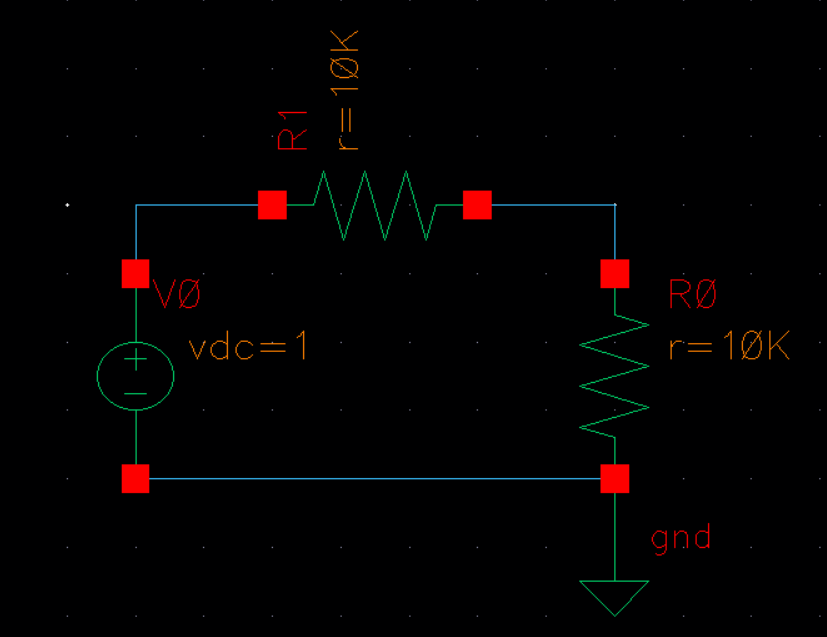
We then do a "check and save" on the schematic and proceed since there are no errors.
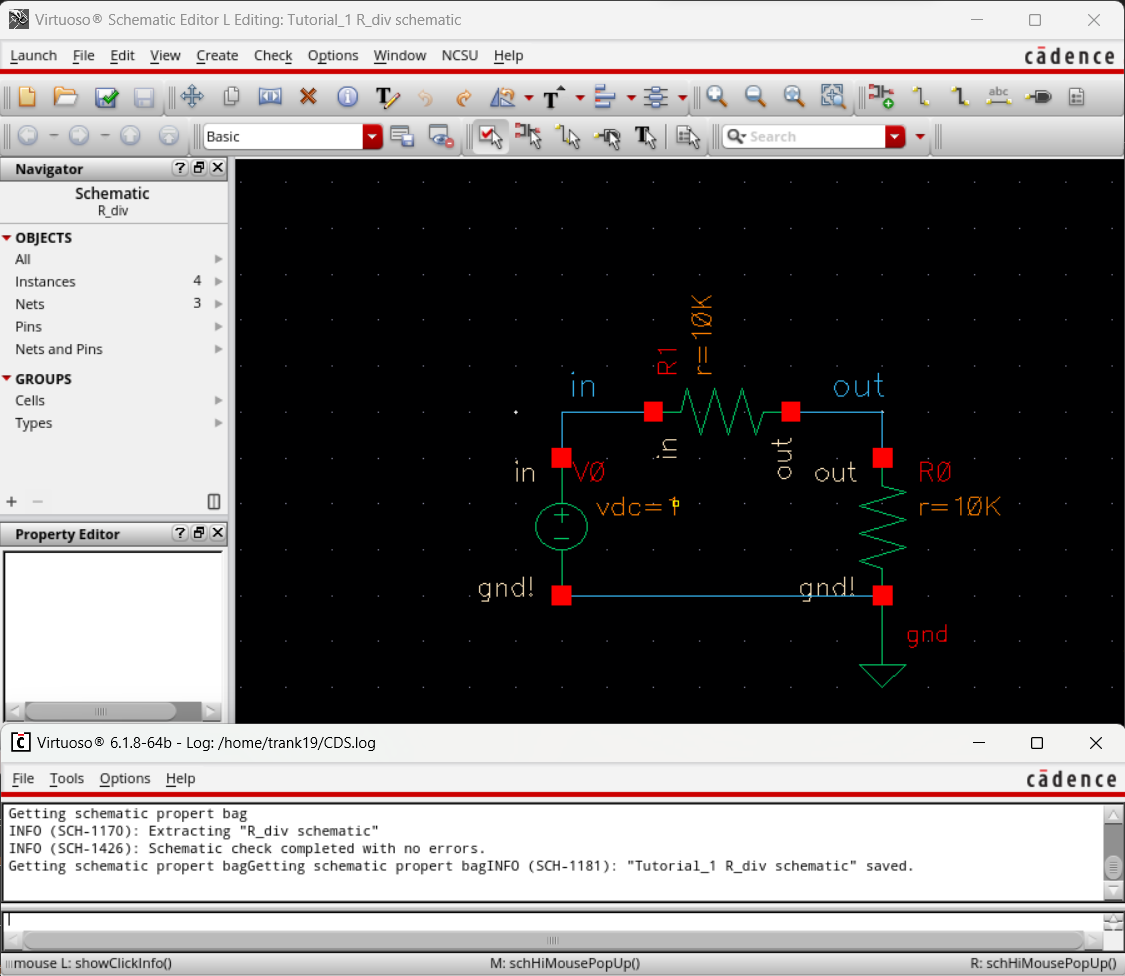
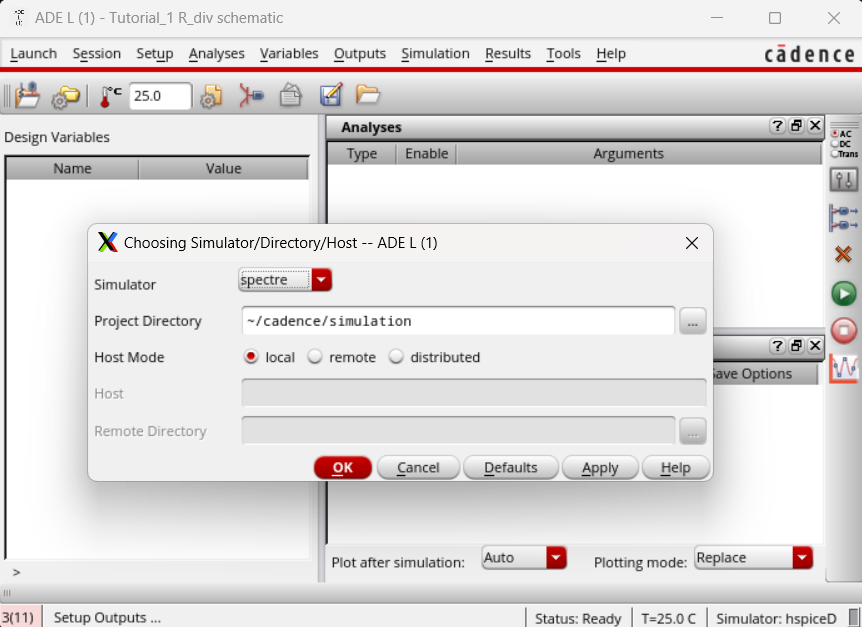
Now we can select Launch -> ADE L. Then under setup -> Simulator/Directory/Host, we select "spectre" as the simulation type.
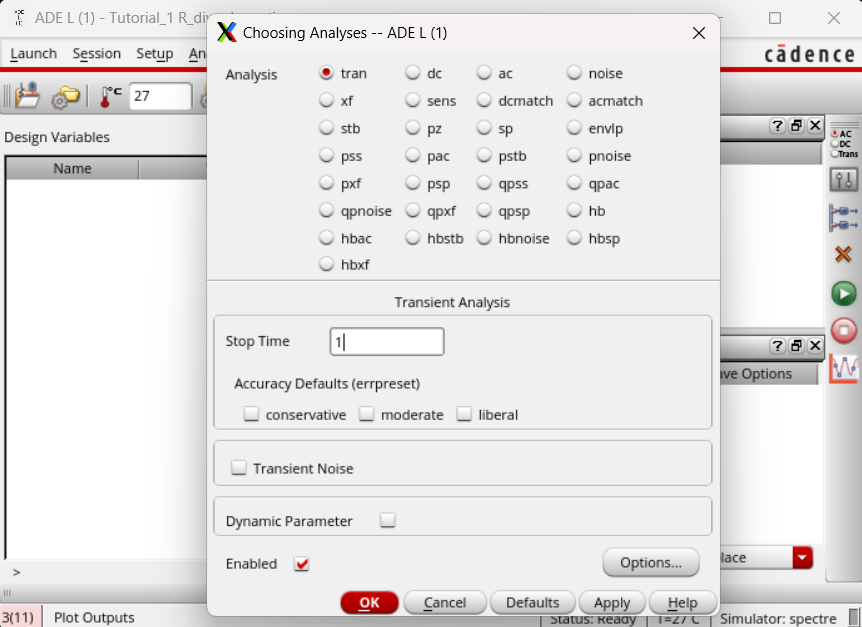
Under Analyses we select "tran" for transient analyses and set the stop time to 1.
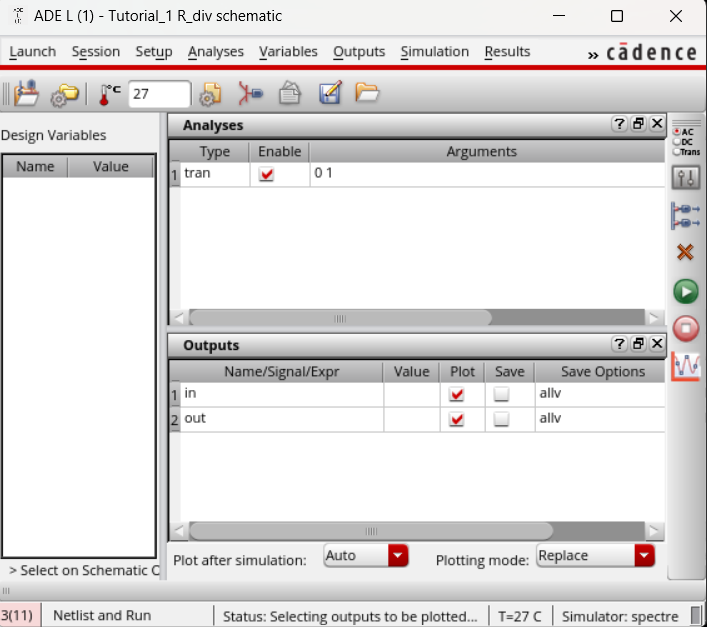
Now we select the outputs we want to plot by selecting Outputs -> To Be Plotted -> Select, then clicking the nodes we want to plot.
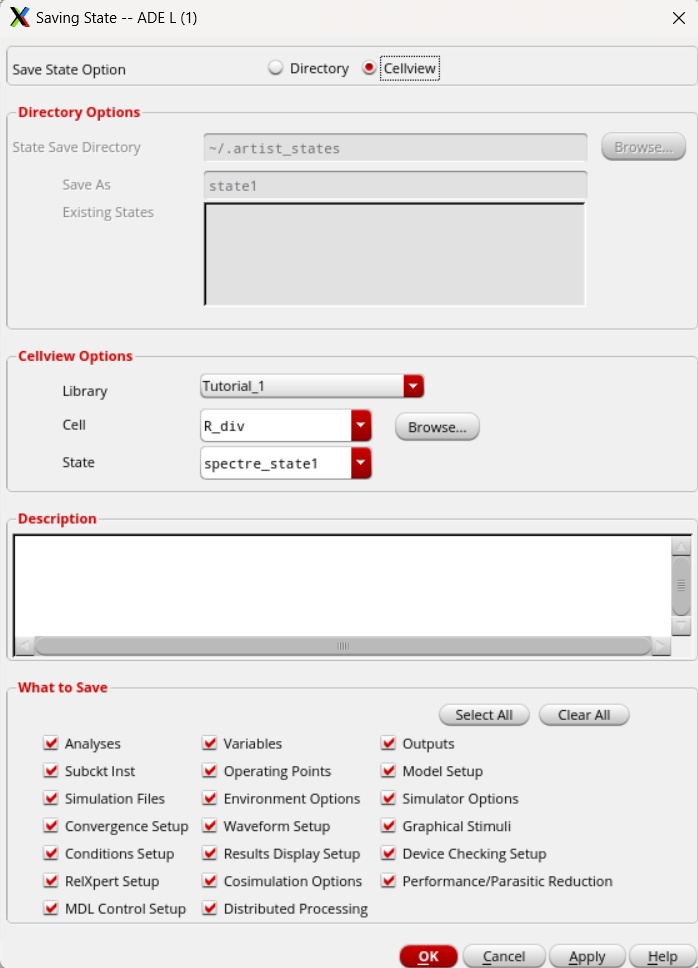
We then save the state for if we ever want to go back and run the schematic again through Session -> Save State and select Cellview then OK.
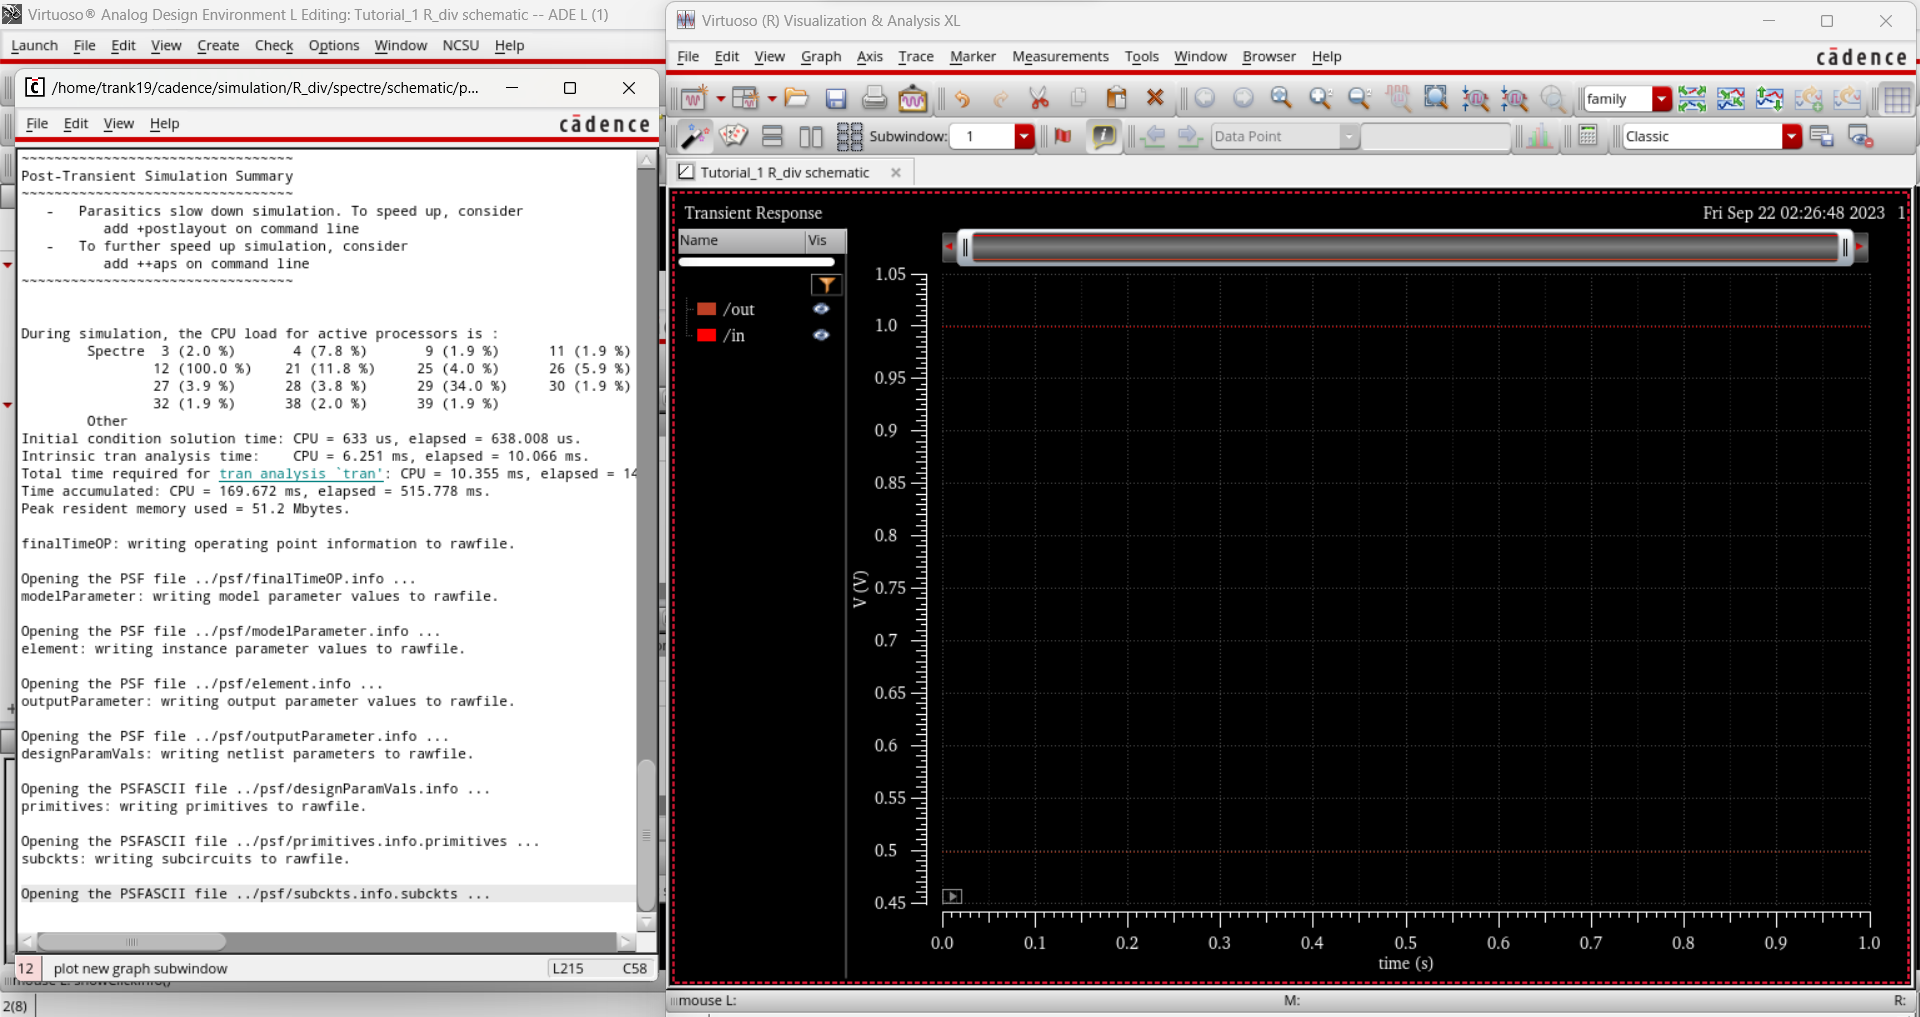
Lastly, we click the green play icon to plot the simulation and we get the results for Vin and Vout below.
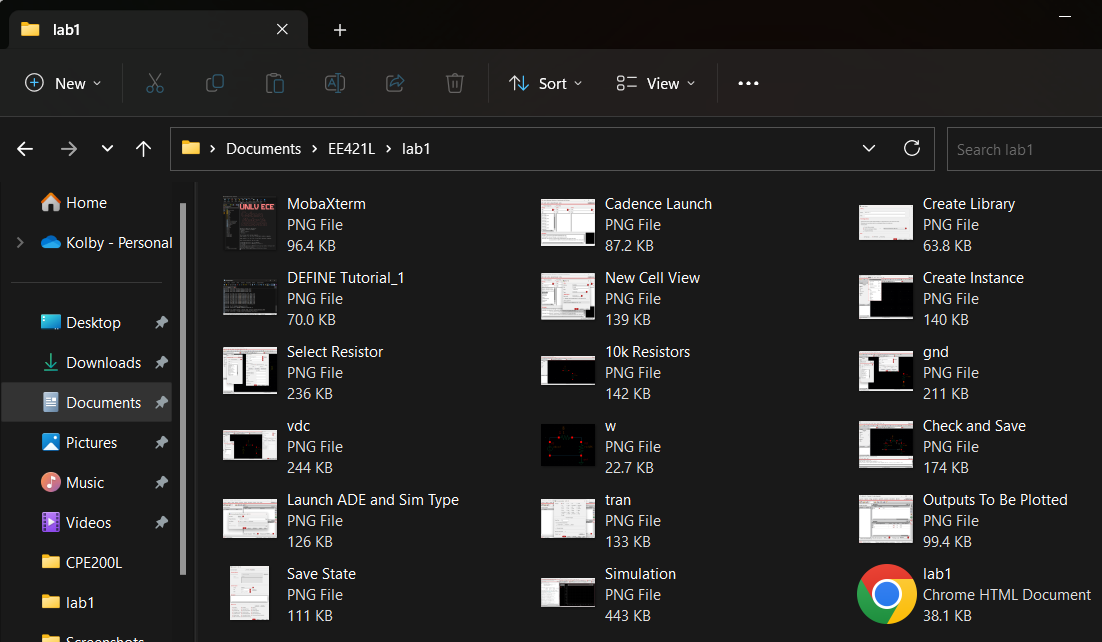
I created a local folder to organize and save all my content for this lab.
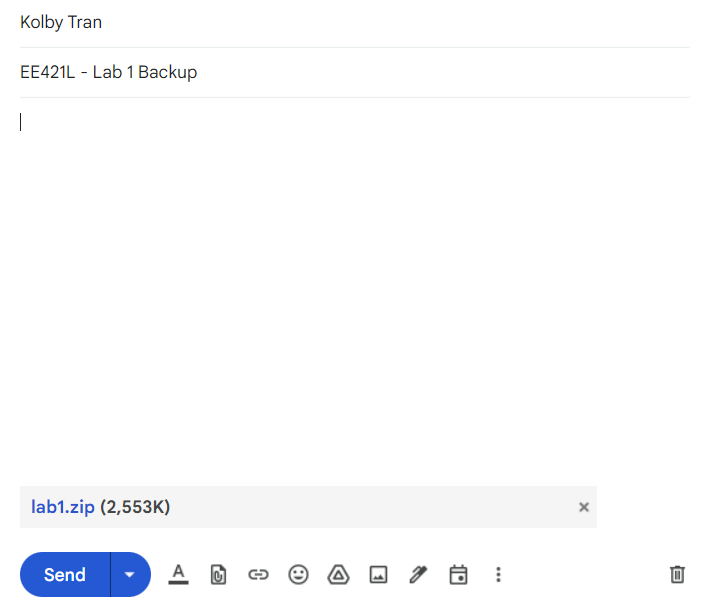
As a backup, I created a zip file then emailed it to myself.
Return to labs