EE 420L Engineering Electronics II - Lab 1
Authored
by David Flores
Email:
flored6@unlv.nevada.edu
Due:
January 30, 2019
Lab Description
·
This
lab consisted of an introduction on editing webpages in HTML on CMOSedu. As well as a review of basic RC Circuits
Pre-Lab
- Your
lab reports will be drafted using html and placed on CMOSedu.
- Prior
to the first day of lab, but no earlier than one week
before the lab starts,request
a CMOSedu account, using your UNLV email address
(!), from Dr. Baker (rjacobbaker@gmail.com).
- Review
the material seen here covering editing webpages (do this before the first lab).
- Read
the entire write-up seen below before coming to lab
Practice
Image on webpage as well as Index
Lab Instructions
For this first lab simulate, and
verify the simulation results with experimental measurements, the circuits seen
in Figs. 1.21, 1.22, and 1.24 (use a 1 uF cap in
place of the 1 pF cap) of the book. Your results
should be similar to, but more complete than, the
simulation results seen on pages 17 - 23. In your report, and for each
circuit, show the
- Circuit
schematic showing values and simulation parameters (snip the image from LTspice).
- Hand
calculations to detail the circuit's operation.
- Simulation
results using LTspice verifying hand
calculations.
- Scope waverforms verifying simulation results and hand
calculations.
- Comments
on any differences or further potential testing that may be useful (don't
just give the results, discuss them).
For the AC response seen in Fig.
1.23 generate a table showing some representative measurement results
(frequency, magnitude, and phase).
Show the lab TA how you are making these measurements.
If
you would like to include a plot of this measured data then using a plotting
program, such as Excel, add the image to your report.
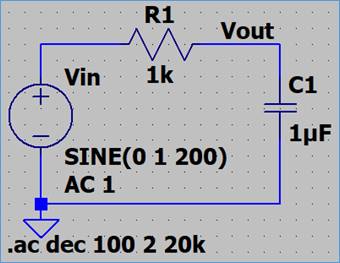
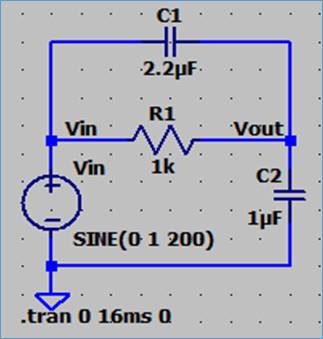
Experiment 1: Figure 1.21
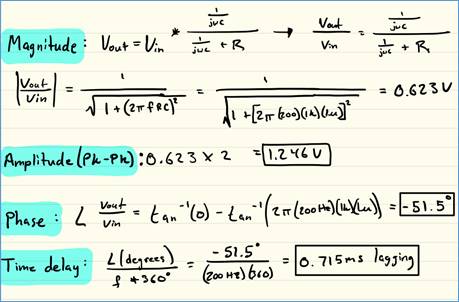
LTSpice schematic from Fig 1.21 Hand Calculations from Fig
1.21
LTSpice waveform Vout and Vin. (Vout pk-pk 1.243mV) Oscilloscope Measurement from Fig 1.21
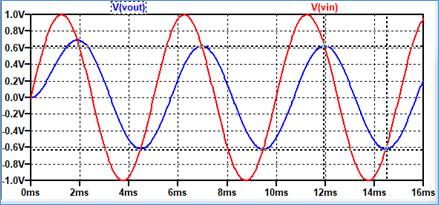
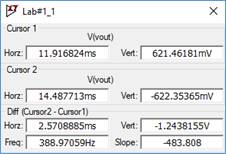
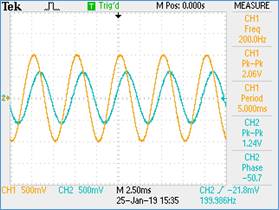
(yellow input, blue output)
|
Fig
1.21 Frequency
(200Hz) |
Amplitude
(pk-pk) |
Phase
( |
|
LTSpice |
1.243V |
-51.6 |
|
Hand
Calculations |
1.246V |
-51.5 |
|
Oscilloscope |
1.24V |
-50.7 |
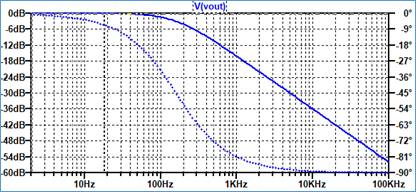
LTSpice Frequency Response of Fig 1.21
|
Frequency
(Hz) |
LTSpice Magnitude (dB) |
LTSpice Phase
( |
Oscilloscope
Phase Vout ( |
|
2 |
-0.685m |
-0.719 |
0 |
|
20 |
-68.5m |
-7.19 |
8 |
|
200 |
-4.15 |
-51.6 |
51.2 |
|
2k |
-22.1 |
-85.5 |
2 |
|
20k |
-41.9 |
-89.5 |
Inconsistent |
Comments:
In this experiment we noticed that as we
increased the frequency the amplitude of Vout
decreased. As we increased the Frequency we also noticed that when we got into
the rage of about 2k or above that frequency the oscilloscope would have trouble
detecting the difference in phase of the two waveforms. In the future using a
better Oscilloscope might be a solution one that could read difference in phase
even at higher frequencies. Or another idea might be to measure the waveform on
the oscilloscope manually as opposed to using the built-in feature which might
have some slight percent error. Other than that, all the Amplitude were within
a 0.5% error, Phase at 200Hz within a 2% error. The only inconsistency came
with the phase at higher frequencies.
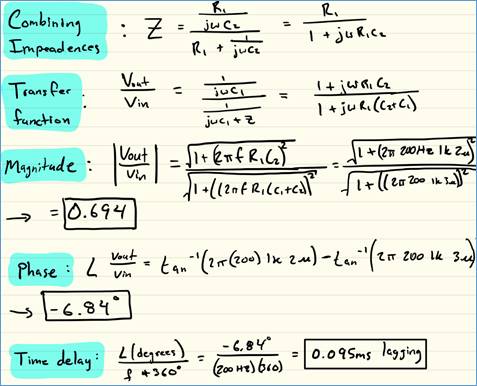
Experiment 2: Figure 1.22
LTSpice schematic from Fig 1.22 Hand Calculations from Fig
1.22
LTSpice waveform Vout and Vin. (Vout pk-pk) Oscilloscope Measurement from
Fig 1.22
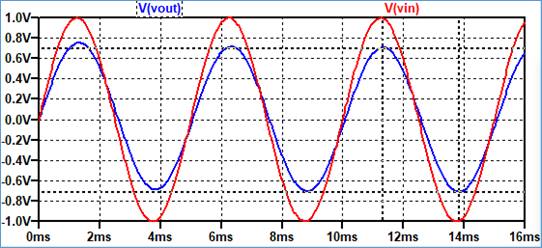
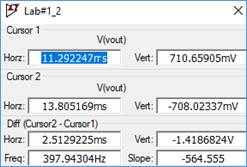
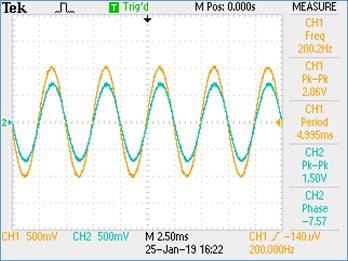
(yellow input, blue output)
|
Fig
1.22 Frequency
(200Hz) |
Amplitude
(pk-pk) |
Phase
( |
|
LTSpice |
1.418V |
-5.86 |
|
Hand
Calculations |
1.38V |
-6.84 |
|
Oscilloscope |
1.50V |
-7.57 |
Comments:
For this experiment we used a 2.2uF capacitor in the LTSpice
simulation as well as for the oscilloscope measurements as opposed to a 2uF in
the book. I used the 2uF for the hand calculations, so we could see the percent
error. There is about an 8%error with the Hand Calculations and the Oscilloscope
this was expected because of the changed capacitor value. The percent error between
LTSpice and Hand Calculations is about 5% better just
not as accurate as Experiment 1.
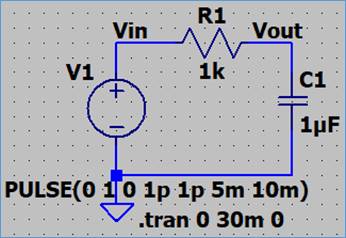
Experiment 3: Figure 1.24
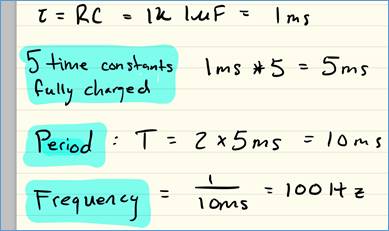
LTSpice Schematic from Fig. 1.24 Hand
Calculations from Fig. 1.24
LTSpice waveform Vout and Vin of Fig. 1.24 Oscilloscope
Measurements of Fig. 1.24
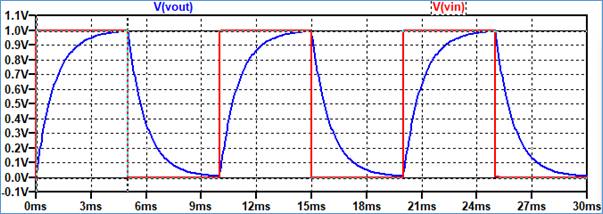
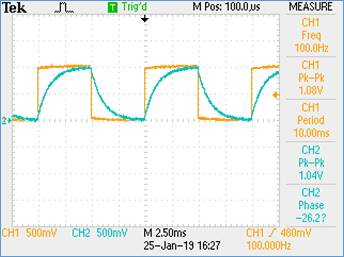
Based
on the LTSpice simulation we can conclude that we
calculated the period to be 10ms, which we can see that it takes about 5ms to fully
charge, and about 10ms to fully charge and discharge also known as the period.
This matches our results from the oscilloscope almost exactly.
Comments:
Basic RC circuit for this experiment all past knowledge just good review to
understand future material. The results are almost identical so there should be
no confusion there. Everything worked as expected.
Conclusion:
These Experiments were great to start back up. They gave me practice with a few
basic RC circuits not to difficult to understand but enough work to have to go
back and do some review LTSpice, Oscilloscope work, and
frequency response.