MATLAB
Examples at CMOSedu.com
- Plot a sinewave in the time domain, plot_sinewave.m
- Additional plotting examples, PlotExample.m
- Plotting a frequency response, magnitude and phase, on a Bode plot, Bode_mag_phase_plot.m
- Graph paper for Bode response plots, bode.zip
- Op-amp Compensation Matlab Design Kit.zip, and Dr. Saxena’s Master’s Thesis with details Indirect Feedback Compensation Techniques for Multi-Stage Operational Amplifiers
- Reading a LTspice raw file example, readLtsRaw.zip
- Resistor's change with temperature, Eq. (5.1), R_vs_T.m
- Bandgap energy of Si, Eq. (23.21) see here for more information, Si_bandgap.m
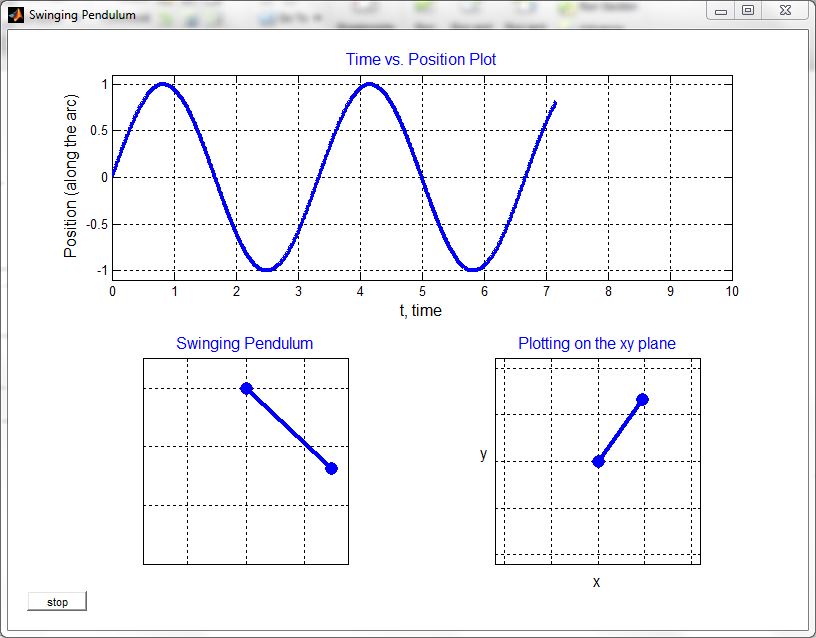
- Pendulum and sinewave examples (animations), Figs. 1.1-1.3 of the Mixed-Signal book, Fig1_1_MSD.m, Fig1_2_MSD.m, and Fig1_3_MSD.m
