EE 420L Engineering Electronics II Lab - Lab 1
Review of basic RC
circuits
Pre-lab
work
- Your lab reports will
be drafted using html and placed on CMOSedu.
- Prior to the first day
of lab get a CMOSedu account, using your UNLV email address, from
Dr. Baker (rjacobbaker@gmail.com).
- Review the material
seen here covering editing webpages (do this
before the first lab).
- Read the entire
write-up seen below before coming to lab
For
this first lab simulate, and verify the simulation results with
experimental
measurements, the circuits seen in Figs. 1.21, 1.22, and 1.24 (use a 1
uF cap in place of the 1 pF cap) of the book.
Your results
should be similar to, but more complete than, the simulation results
seen on
pages 17 - 23. In your report, and for each circuit, show the
- Circuit
schematic showing values and simulation parameters (snip the image from
LTspice).
- Hand
calculations to detail the circuit's operation.
- Simulation
results using LTspice verifying hand calculations.
- Scope
waverforms verifying simulation results and hand calculations.
- Comments
on any differences or further potential testing that may be useful
(don't just give the results, discuss them).
It's important for your report to be concise. The images
should be
large enough that the reader can see the
information (e.g.,
the numbers on the axes of a plot) but not so large that the image
contains a lot of space with no information. Don't be too verbose with
the
comments or
algebra either. Long reports are rarely useful reports.
For the AC response seen in Fig. 1.23 generate a table showing some
representative measurement results (frequency, magnitude, and
phase).
Show the lab TA how you are making these measurements.
If you
would like to include a
plot of this measured data then using a plotting program, such as
Excel, add the
image to your report.
The
Laboratory Report -
Create the
lab1.htm report in a folder also called lab1 in your CMOSedu
account.
For example, for
the user "jake", http://cmosedu.com/jbaker/courses/ee420L/s14/students/jake/.
and, within the
lab1 folder seen above, see: http://cmosedu.com/jbaker/courses/ee420L/s14/students/jake/lab1/,
the report will be, again,
lab1.htm.
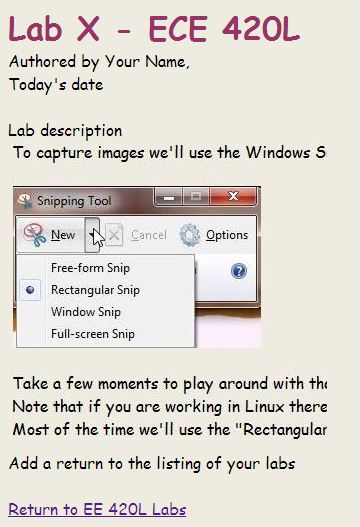
The figures will be generated using the snipping tool (Start ->
All Programs
-> Accessories -> Snipping Tool)
after clicking on lab1.htm we get
Ensure
that your html lab report includes your name, the date, and your email
address at the beginning of the report (the top of the
webpage).
When
finished backup your work.