EE 420L - Lab 1 - Review of Basic RC Circuits
Pre-lab work
- Request a CMOSedu account.
- Review the material seen here.
- Read the entire write-up.
Introduction
This
lab served as an introduction to the formats and procedures required
for every lab this semester as well as a friendly refresher for RC
circuit.
Experiment 1
Hand Calculations
This
circuit is a low pass filter which will attenuate high frequency
signals. By our calculations, a signal with an amplitude of 1V should
attenuate down to 0.622V with a 51.4░ phase shift.
Spice Simulations


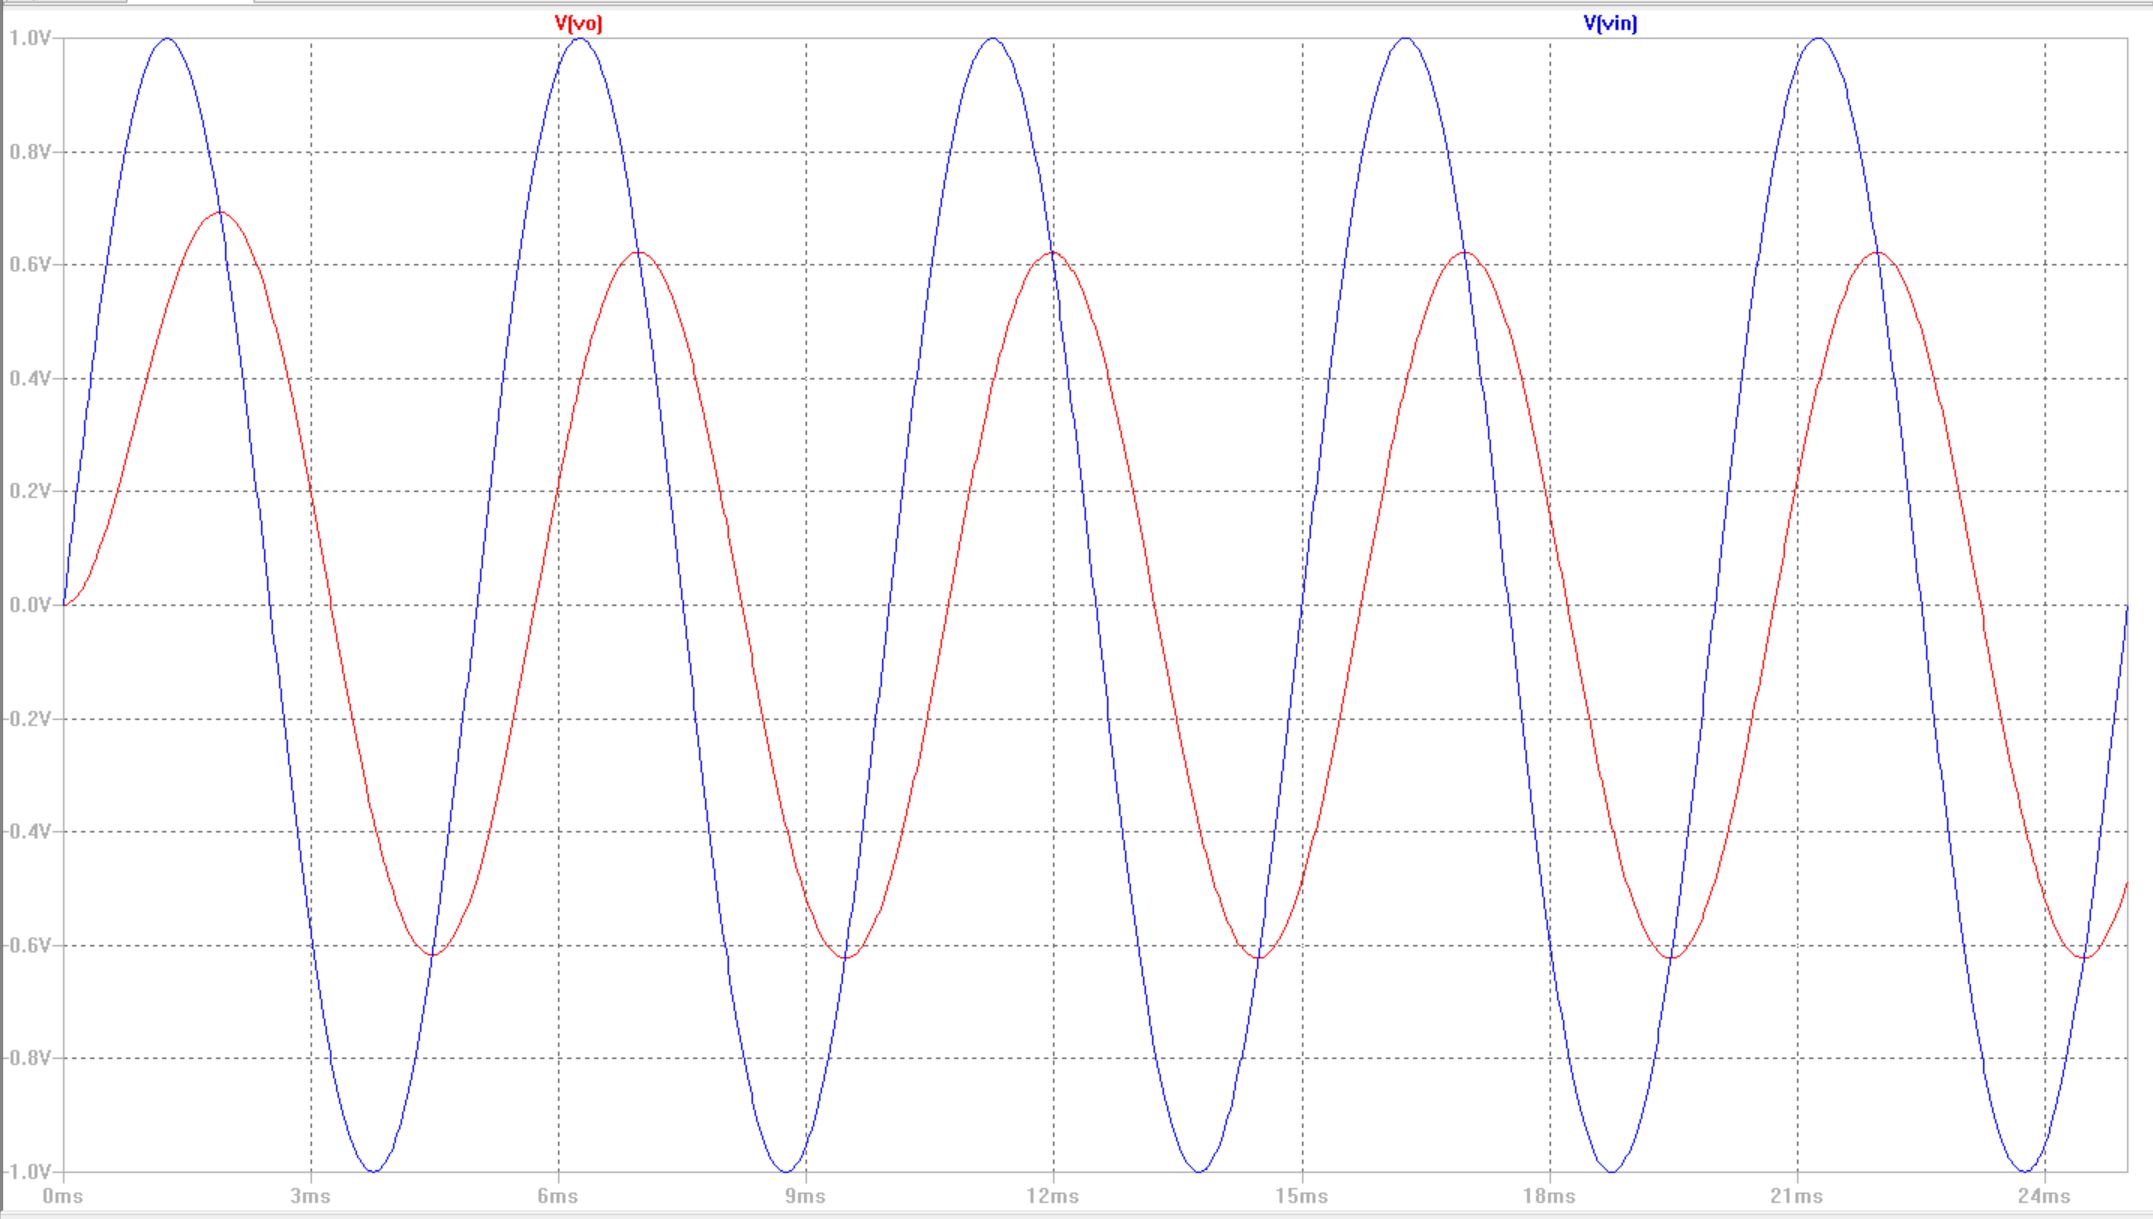
Our LTSpice simulation showed exactly what we expected: a phase shifted signal with an amplitude of around 0.6V.
Experimental Data

I promise that this is not a simulation, rather the software and product by PicoScope.
Looking at the measurements in the bottom, we can see an input
sinusoidal amplitude of about 1V at 200Hz with an output voltage of
0.629V, matching what our hand calculations and simulations told us.
The time difference between the peaks is 703Ás. Using the period of a
200Hz signal (5ms), we can determine that 0.703/5*360= 50.6║ of a phase
shift, again matching our hand calculations.
Experiment 2
Hand Calculations
With the capacitor in parallel with the resistor,
that impedance is less than before, so we should see a smaller
attenuation the before. Our hand calculations show a different story,
however we can blame plugging in numbers in different stages rather
than all at the end. This circuit will also cause less of a phase shift
than the previous one.
Spice Simulations
LTSpice
confirms the assumption that this circuit will attenuate the same
signal less since the magnitude of this waveform is around 0.67V
instead of 0.62V. The phase shift is minimal if not non-existent.
Experimental Data
From our measurement in the lab, we can actually see a small phase shift measured by the time delay between peaks: 117Ás.
This information allow us to determine that there was an 8.4║ phase
shift. The magnitude of the output voltage is 0.69V instead of the 0.62
from last time, backing up our original assumptions.
Experiment 3
Spice Simulations
The
simulation shows how the voltage across the capacitor increases and
discharges in an exponential fashion with a time constand dependent on
the values of R and C.
Experimental Data


The Picoscope that I was using as
both an oscilloscope and as a function generator is powered through
USB, which means it is limited in the amount of current it can drive
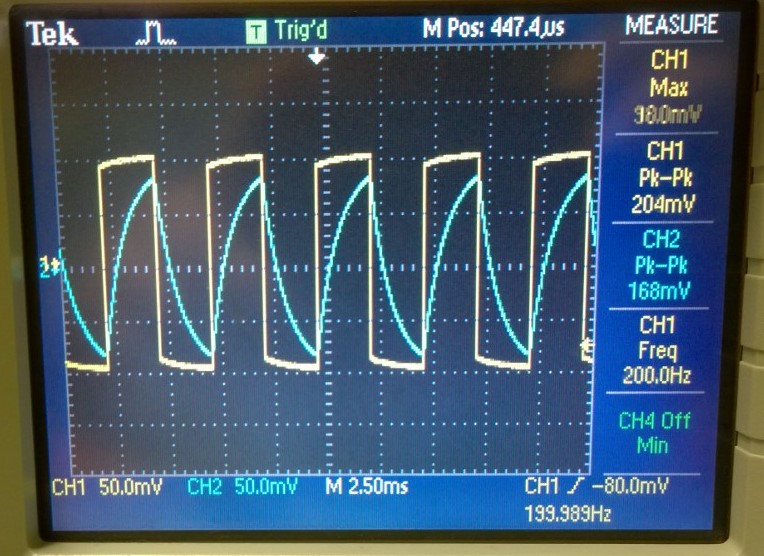
with a given load, especially when creating a square wave. To the right
is the waveform of the lab oscilloscope (better square wave under
load). We can see that the capacitor discharges in an e^(-t/RC) fashion
unit the next pulse arrives.
Conclusion
This was a simple refresher for RC
circuits and an introduciton to the different policies implimented in
this lab versus previous ones.
Return
Return to EE420L Student Directory
Return to EE420L Page
Return to CMOSedu