Lab 1 - EE 421L
Meredith Kline
09/06/2023
First,
I opened Cadence and made sure I was in the correct directory. Then, I
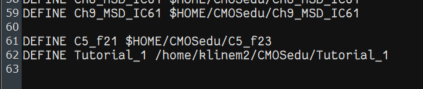
edited my cdslib file since I was already in Mobaxterm.
Then, I started Virtuoso and created a new library. I attached the AMI 0.60u C5N process.
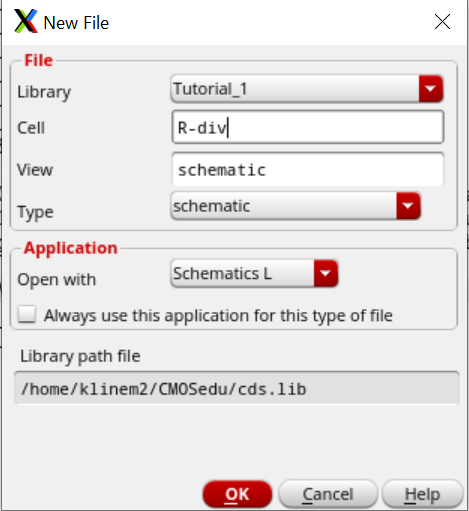
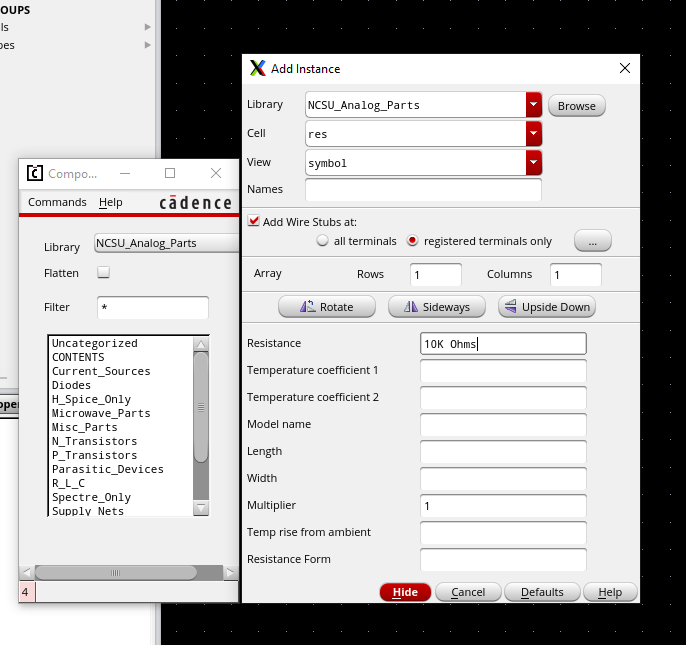
I opened the Tutorial 1 schematic and added instances by pressing I and typing res, vdc, and gnd into the box labelled "Cell."
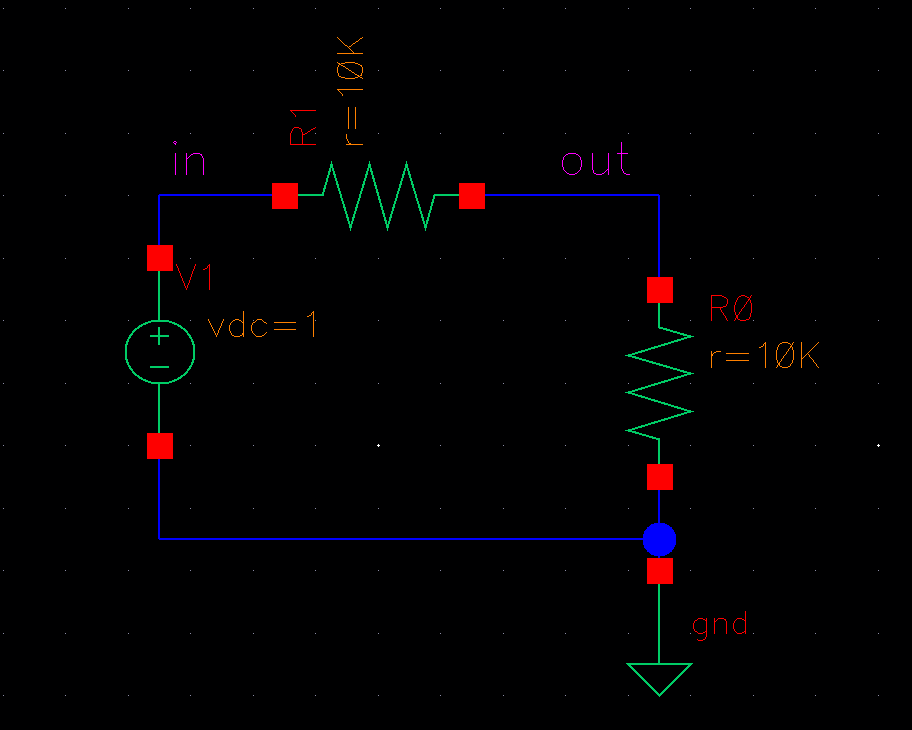
This is my final circuit created.
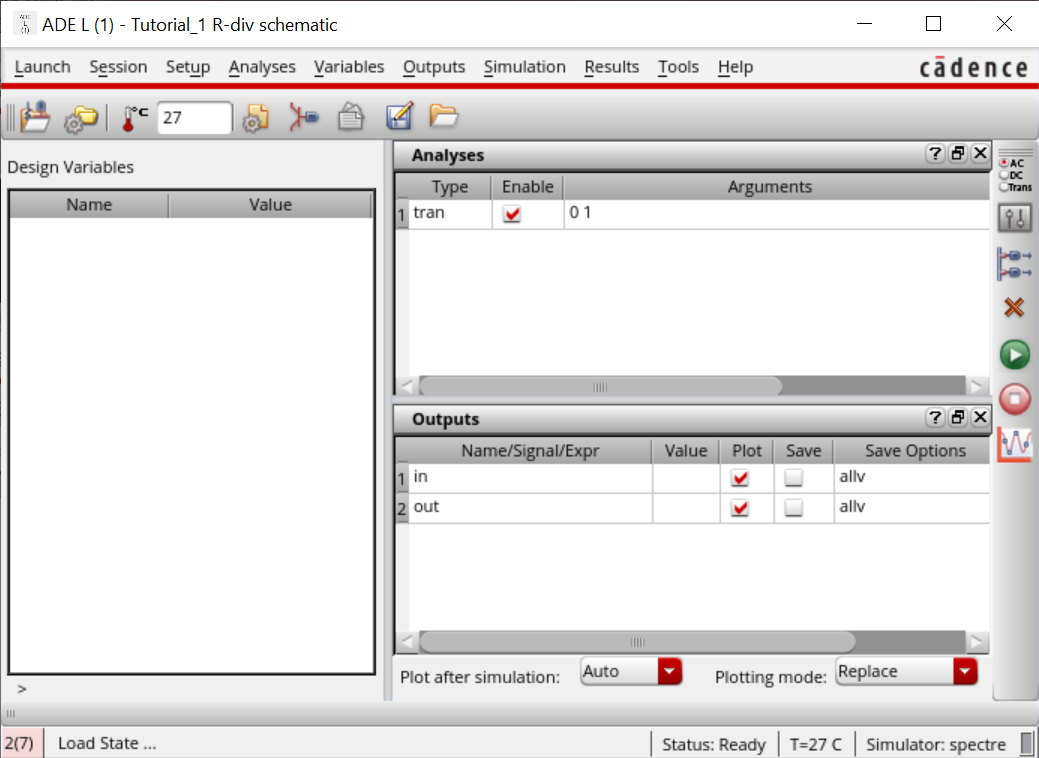
I
ran ADE L and changed the setup to spectre. Then I clicked on Session
--> Load State and clicked Cellview instead of Directory. I chose a
transient analysis.
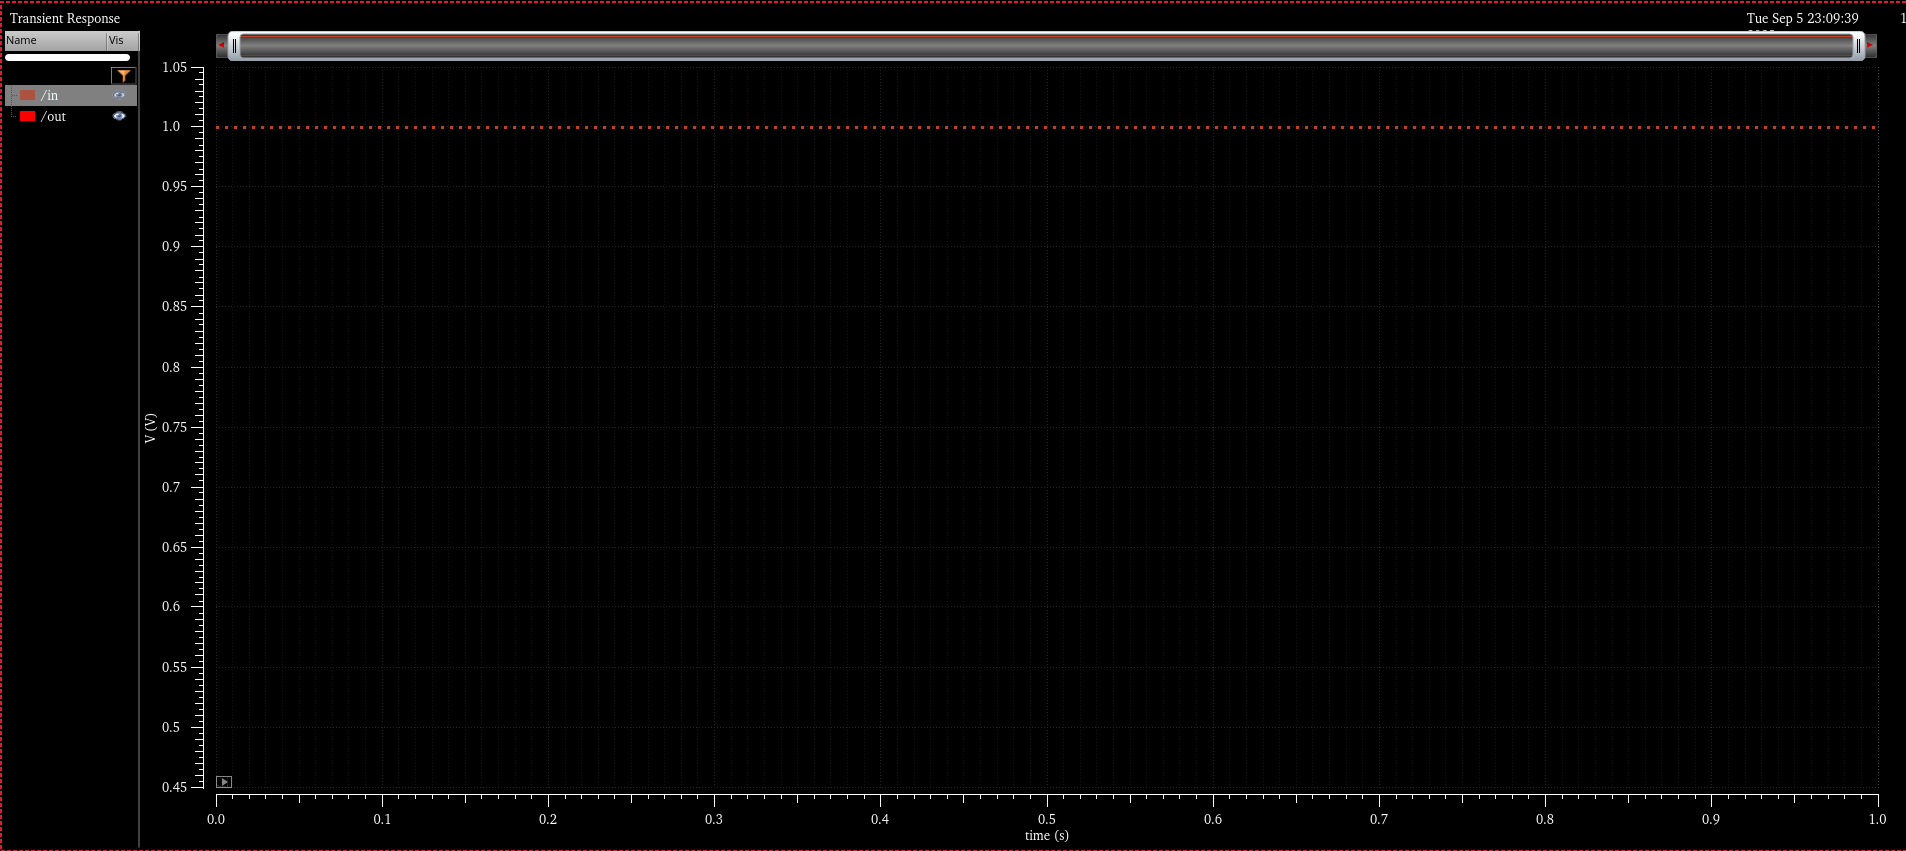
This
is my final graph. One can see that Vin is 1, and Vout is 0.5. There
was a bolder red line at 0.5. I'm not sure why it showed up so light.
I sent my lab to myself twice.
This lab taught us how to build a simple circuit and graph it using a transient analysis.
Return to EE 421L Labs


