Lab 1 - EE 421L
Authored
by Emmanuel Sanchez,
Email: sanch512@unlv.nevada.edu
8/23/2015
Laboratory introduction, generating/posting html lab reports, installing and using Cadence
Lab
description:
-The purpose of this lab is to learn how to edit pages in our CMOSedu
account using KompoZer and how to transfer files via FTP.
-This lab also covers the basics of how to use Cadence on the
csimcluster to create schematics and run simulations.
Pre-lab work
- The lab reports will be drafted using html and placed on CMOSedu.
- Prior
to the first day of lab, but no earlier than one week before the lab
starts, get a CMOSedu account, using your UNLV email address, from Dr.
Baker, rjacobbaker@gmail.com
- Review the material seen here covering editing webpages (do this before the first lab)
Report:
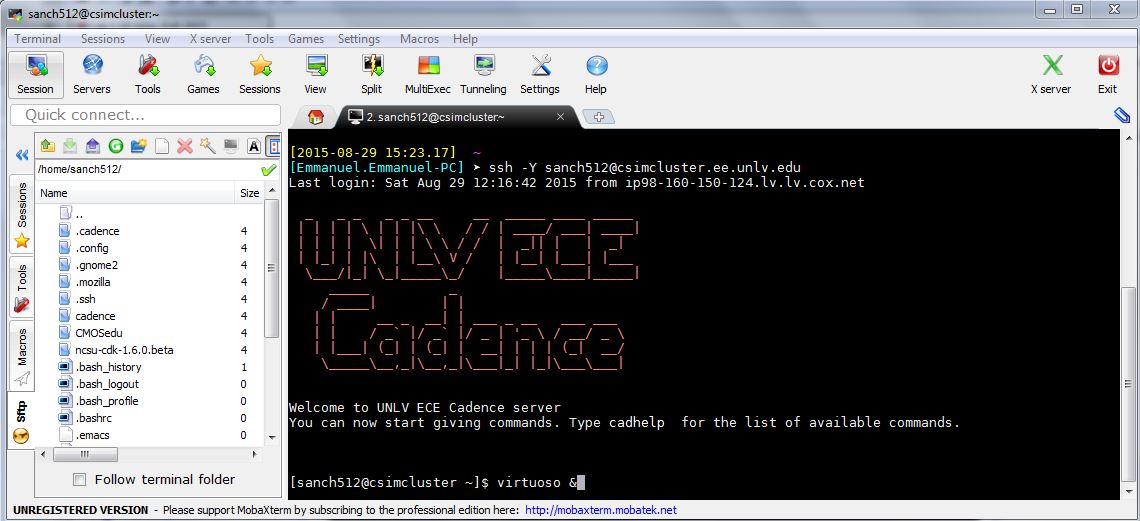
After Cadence has been set up, we login to the cluster by typing ssh -Y username@csimcluster.ee.unlv.edu and run Cadence by typing virtuoso & (the & allows us to run the program in the background).
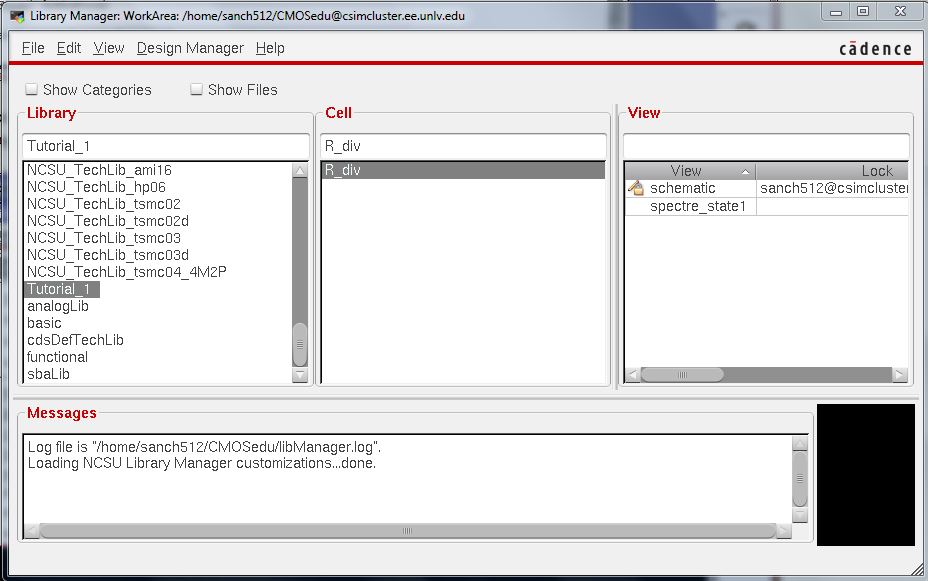
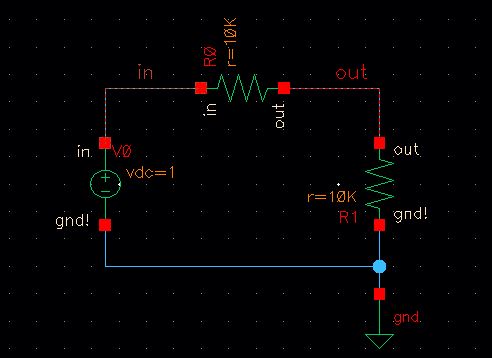
In the library manager, we create a new library called Tutorial_1 and we make a schematic for it.
In the schematic editor, we add instances (components) by pressing i, wires by pressing w, add labels by pressing l. We can also use the icons circled below for the same purpose.
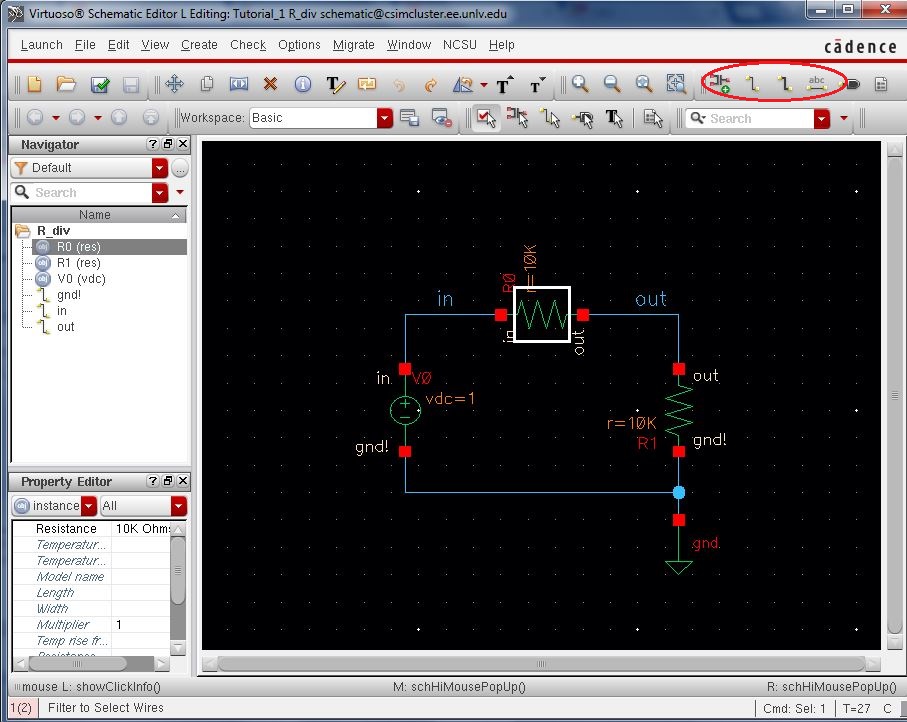
To insert a new instance (component) to the schematic, we press i.
In the image below, the window on the left allows us to navigate
through the components and the window on the right allows us to set the
properties of the selected component.
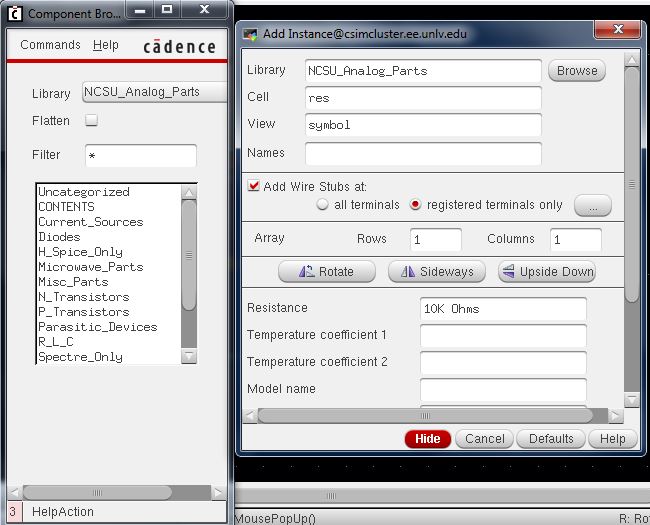
To edit a component's properties, we click the component and press q.

When we are ready to simulate, we go to Launch -> ADE L. When the Analog Design Environment (ADE) opens, click Analyses -> Choose and select tran analysis with stop time = 1 (second). This assumes spectre is already set as the default SPICE.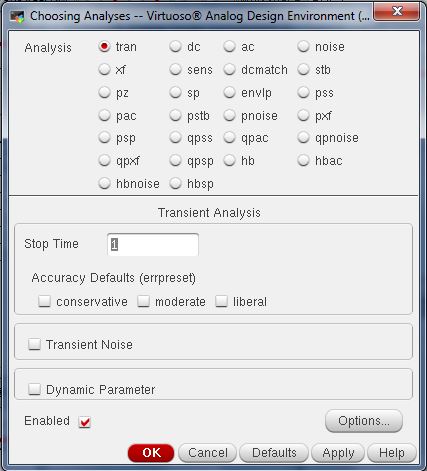
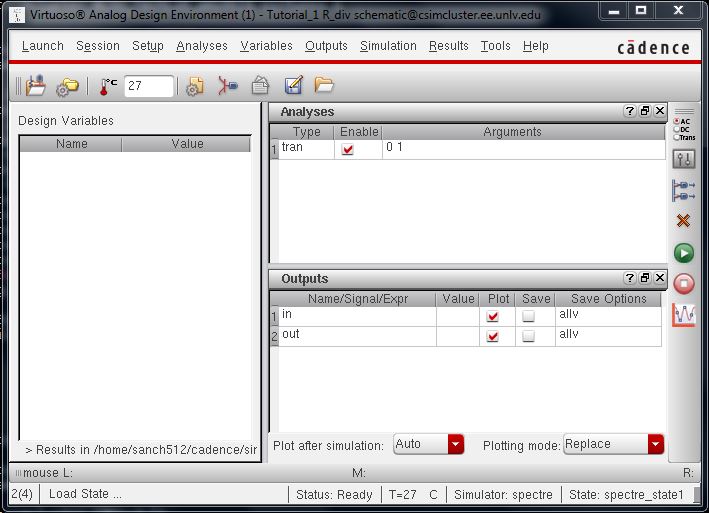
Next we need to specify which signals we want to plot. We click Outputs -> To Be Plotted -> Select On Schematic, and then on the schematic we select the in and out wires.
The
ADE should now look like the image below. We are now ready to run the
simluation. Click the green play arrow on the right side of the screen
to run the simulation and generate the plot.
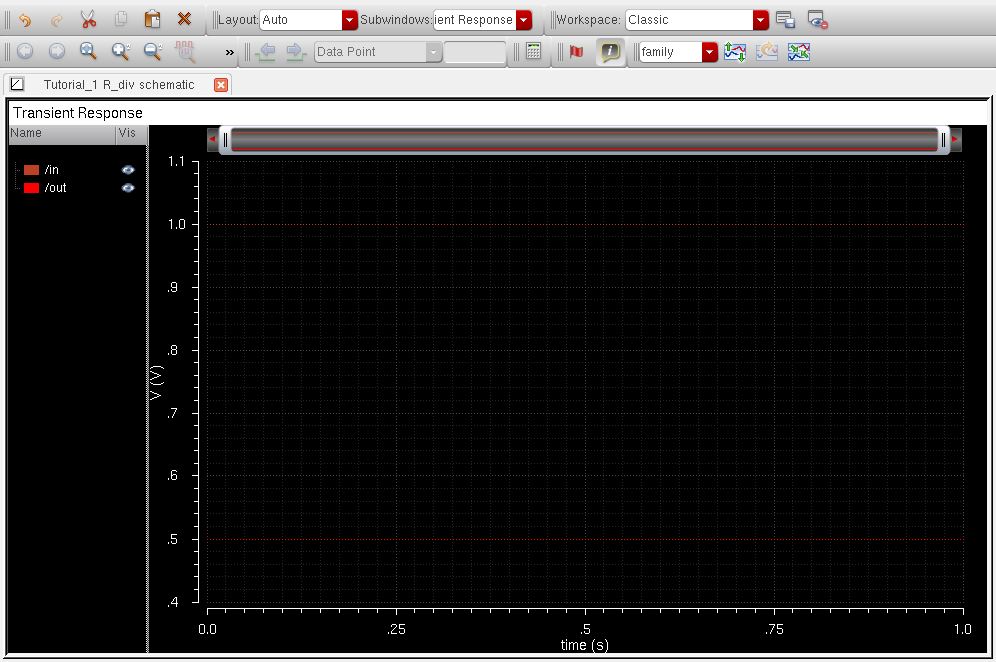
After
pressing the green play button, the transient analysis runs and the
following graph shows up. We can see that the voltage divider was
simulated correctly (input = 1V and output = 0.5V).
File Backups:
-All lab files will be backed up on a folder that I will then email to myself as a .zip file.

-The .zip file will include the date the lab report was finished.
Return to EE 421L Labs