EE 420L
Analog
Integrated Circuit Design Laboratory
Project:
Design and Implementation of aVoltage Amplifier
AUTHOR:
Bryan Kerstetter
EMAIL:
kerstett@unlv.nevada.edu
MAY
8, 2019
General
Overview
This is the concluding project of the EE 420
laboratory. We are given the task of designing a voltage amplifier with the
following design requirements:
·
Voltage gain of 10
·
Drive a 1kΩ load
·
Input resistance greater than 50kΩ
·
Largest output swing possible
·
Pass a 100 Hz signal
·
9V power supply voltage
·
Amplifier to draw no more than 1mA under
quiescent conditions (no input signal)
Design
A Push-Pull Amplifier
The push-pull amplifier consists of two MOSFETS. The
two MOSFETs are both connected at their drains. The configuration can be
likened to an inverter. The push-pull MOSFET amplifier topology allows for a
device that allows the output to nearly swing from rail to rail (VDD to GND).
This wide voltage swing is one benefit of the push-pull
amplifier. Due to the wide output swing, the push-pull amplifier is
commonly used as an output stage. Positive AC current causes the gates of both
MOSFETs to rise in voltage. Such that the positive current leads to the PMOS
being turned off. While, the NMOS is on. The situation of negative AC current
leads to a state where PMOS is on and the NMOS is off. The amplifier is
either pushing or pulling (sourcing or sinking) current to or
from the output. The input source can either be placed on either the NMOS or
PMOS gate. Let’s assume that we have a push-pull amplifier of the topology
given in Figure 1.

Figure 1
During circuit analysis, to simplify calculations, we
may disregard ![]() .
Additionally, under AC analysis, we may consider
.
Additionally, under AC analysis, we may consider ![]() ,
,![]() ,
,![]() ,
and
,
and ![]() as a short. The gain of this
push pull amplifier can be determined in the following manner.
as a short. The gain of this
push pull amplifier can be determined in the following manner.
![]()
![]()
Find ![]() :
:
![]()


![]()
Find ![]() :
:
![]()
![]()
![]()

![]()
Therefore, we may say that ![]() is the following:
is the following:


Finally, we may say that the gain of this push-pull amplifier
is:

The input resistance can be determined by isolating ![]() and
and ![]() in
a manner as seen in Figure 2.
in
a manner as seen in Figure 2.

Figure 2
The input current can be defined as the following:
![]()

Input and Output Time Constants (![]() and
and ![]() )
)

Figure 3
The speed of a circuit can be determined how quickly
the output voltage responds to a change in the input voltage. An amplifier’s
slew rate is the greatest rate at which the output voltage can change.
![]()
The speed of the circuit can be increased by minimizing the
input (![]() )
and output (
)
and output (![]() )
time constants.
)
time constants.
![]()
![]()
While designing fast amplifiers, ![]() and
and ![]() should all be minimized to ensure minimal
input and output time constants. In this project, the requirement regarding
input resistance is that the input resistance must be greater than 50kΩ.
To ensure a minimal input time constant, the input resistance should be close
to 50kΩ. As demonstrated previously, the input resistance of the
push-pull amplifier (in Figure 1) is a function of both small signal voltage
gain (
should all be minimized to ensure minimal
input and output time constants. In this project, the requirement regarding
input resistance is that the input resistance must be greater than 50kΩ.
To ensure a minimal input time constant, the input resistance should be close
to 50kΩ. As demonstrated previously, the input resistance of the
push-pull amplifier (in Figure 1) is a function of both small signal voltage
gain (![]() )
and
)
and ![]() .
If a gain is specified,
.
If a gain is specified, ![]() is the only parameter a designer may alter to
adjust the input resistance. However,
is the only parameter a designer may alter to
adjust the input resistance. However, ![]() must remain considerably large as the small
signal gain calculations are dependent upon the assumption that the resistance
is large enough to be treated as an open. Generally, the input resistance will
be rather large (unless
must remain considerably large as the small
signal gain calculations are dependent upon the assumption that the resistance
is large enough to be treated as an open. Generally, the input resistance will
be rather large (unless ![]() is specifically chosen for a input resistance
certain value) as demonstrated in the following example.
is specifically chosen for a input resistance
certain value) as demonstrated in the following example.
![]()
Where ![]() and
and ![]() ,
,
![]()
Using the same method, one may see that a ![]() value of 550kΩ would result in an input
resistance of 50kΩ (for a push-pull amplifier with a gain of 10).
However, the question must be asked: Is 550kΩ a large enough resistance
value to be ignored? It is possible to create an amplifier with an input
resistance independent of small signal gain and
value of 550kΩ would result in an input
resistance of 50kΩ (for a push-pull amplifier with a gain of 10).
However, the question must be asked: Is 550kΩ a large enough resistance
value to be ignored? It is possible to create an amplifier with an input
resistance independent of small signal gain and ![]() .
This route was chosen.
.
This route was chosen.
A NMOS Common-Source Amplifier
A common-source amplifier consists of a NMOS or PMOS.
In this case, an NMOS common-source amplifier was chosen![]() .
The signal enters the gate of the MOSFET and the output signal leaves the drain
of the MOSFET. A general topology of a
NMOS common-source amplifier can be seen in Figure 4. The
gain of the common-source amplifier can be determined by the following
equation:
.
The signal enters the gate of the MOSFET and the output signal leaves the drain
of the MOSFET. A general topology of a
NMOS common-source amplifier can be seen in Figure 4. The
gain of the common-source amplifier can be determined by the following
equation:
![]()
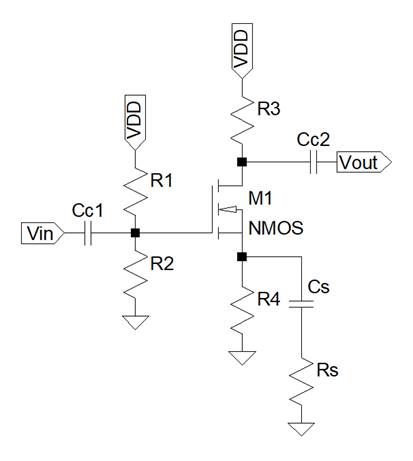
Figure 4
The gain of a NMOS common-source amplifier of the topology seen
in Figure 4, can be derived in the following manner.
![]()
![]()
![]()

![]()
Where we may define the output voltage to be,
![]()
![]()
Where we finally arrive to our small signal gain,
![]()
The input resistance can be said to be the following,
![]()
Here, we see that the input resistance is only dependent upon
two resistance values and is completely independent of the amplifier’s gain
(unlike the input resistance of the previously described push-pull amplifier).
Additionally, a wide range of precise input resistances can be calculated. For
instance, if ![]() ,
then
,
then ![]() .
.
Creating a Two Stage Voltage Amplifier

Figure 5
A two stage amplifier will be designed with coupling
capacitors isolating each stage. Coupling capacitors ensure that each stage has
the proper DC biasing. The push-pull amplifier is a great output stage because
of its inherent wide output swing. However, as demonstrated the push-pull
amplifier topology requires a rather interesting method of determining input
resistance. Therefore, a NMOS common-source amplifier will be used as a
preamplifier stage. The total gain of a two stage amplifier is the gain of the
first stage multiplied by the gain of the second stage. In summary, a two stage
amplifier will be created where a NMOS common-source amplifier is the first
stage and a push-pull amplifier is the second stage (see Figure 6).

Figure 6
Based upon the previous discussion regarding a NMOS
common-source amplifier and push-pull amplifier, we may assert the following
regarding the two stage amplifier.
The net gain of the amplifier:
![]()
The gain of the first stage:
![]()
The input resistance of the entire amplifier:
![]()
Now we must calculate the gain of the second stage.
However, an issue is encountered. In previous calculations, ![]() and
and ![]() was
regarded as shorts. If
was
regarded as shorts. If ![]() and
and ![]() are treated as shorts, the gain of the second
stage can be defined as the following.
are treated as shorts, the gain of the second
stage can be defined as the following.

However, we know this not to be the case, due to the fact that
both ![]() and
and ![]() influence the gain of the second stage. One
might say that maybe we could treat the capacitors as an open and only regard
the resistances. In this case, the gain of the second stage can be said to be:
influence the gain of the second stage. One
might say that maybe we could treat the capacitors as an open and only regard
the resistances. In this case, the gain of the second stage can be said to be:

However, there is a further there is an issue with this gain
formula as neglecting the capacitances destroy the gain. Therefore, it can be
said that ![]() and
and ![]() are necessary bypass capacitors. These bypass
capacitors ensure that the gain and the circuit is stable. Therefore, a new
gain formula must be calculated where the impedance of
are necessary bypass capacitors. These bypass
capacitors ensure that the gain and the circuit is stable. Therefore, a new
gain formula must be calculated where the impedance of ![]() and
and ![]() are accounted for.
are accounted for.

We know the impedance of the capacitor to be the following:
![]()

![]()
![]()
Therefore, we can define the gain to be:

Therefore, we can say that the net gain of our two stage
amplifier is:

Testing
our Derived Formulas and Creating a LTspice Model
Now that a circuit has been designed we may create an LTspice model of the circuit to perform simulations of our
design.

Figure 7
Now we may determine the gain of this model with the formula
that we have already developed:

Figure 8
According to the LTspice
error log we may determine the following transconductance values:
![]()
![]()
![]()
According to previously derived formulas in the Creating a Two Stage Voltage Amplifier section
we may assert:
![]()
![]()

Therefore, we may say that the net gain of our two stage
amplifier can be described as a function of angular frequency:

Allowing us to evaluate the following:
![]()
![]()
Finally, if we let ![]()
![]()
Therefore, we can assert that our two-stage amplifier should
have a gain of ~11 V/V.
![]()
Additionally, we may say that our amplifier has the following
input resistance:
![]()
Finally, we may simulate our two-stage amplifier design as
demonstrated in Figure 9 and 10.
Input
and Output Signal

Figure 9
Input
Resistance

Figure 10
In LTspice
it can be seen that the gain is 10.19
V/V and the input resistance is 50kΩ.
Comparing
Hand Calculations and the LTspice Model
Table 1
|
|
Hand
Calculations |
LTspice Simulation |
|
Input
Resistance |
50kΩ |
50kΩ |
|
Gain |
|
10.19 |
Here, according to Table 1, we see that our hand calculations
and our LTspice model are in agreement. Now we may
further test our LTspice model.
Output
Swing

Figure 11
Frequency
Response

Figure 12
Current
Draw at Quiescent
Conditions

Figure 13
Slew
Rate

Figure 14
Summary
of Simulation Results
Table 2
|
Design
Requirement |
State |
|
Gain of 10 V/V |
10.19 V/V |
|
Drive a 1k Load |
Confirmed |
|
Input Resistance > 50kΩ |
50kΩ |
|
Largest Output Swing Possible |
4.7 V |
|
Pass 100 Hz Signal |
Confirmed |
|
9V Power Supply |
Confirmed |
|
Draw No More Than 1mA Under Quiescent Conditions |
270µA |
|
Slew Rate |
1.06 V/µs |
According to Table 2, one can see that all the
necessary design requirements are met. Therefore, we may now transition from
design to implementation.
Experimental
Results
The two stage topology given in Figure 6 and 7 was
further modified upon construction of the circuit on the breadboard. Capacitance
and resistance values were selected based upon availability. Additionally, upon
building the circuit given in Figure 7, it was realized that the physical
circuits gain was much less than the gain experienced in LTspice.
Possibly, this could be due to a limitation of the LTspice
MOSFET model or other factors that the SPICE is neglecting. Therefore,
resistance values were then trimmed to ensure that the amplifier implementation
had an experimental gain of 10. Figure 15 shows the exact circuit implemented
on the breadboard. Figure 16 shows the LTspice
simulation of the two stage amplifier with experimental resistance and
capacitances. In LTspice the gain is 27, but the
physical implementation has a gain of 10. Therefore, it seems that our LTspice results and our hand calculations are in agreement,
but our physical implementation is contrary to those. Figure 17 shows the
breadboard of which the amplifier was built.

Figure 15

Figure 16

Figure 17
Input
and Output Signal

Figure 18: At a frequency of 10kHz
Figure 19 we see a 20mVpp input signal that is then
amplified to a 200mVpp output signal. Therefore, our circuit has an
experimental gain of 10 V/V.
Input
Resistance
The input resistance was measured experimentally in a
manner seen in Figure 19.

Figure 19

Figure 20: VT1

Figure 21:VT2
![]()
![]()
![]()
![]() …
…
![]()
Frequency
Response

Figure 22: At a frequency of 7Hz
Table 3
|
Freq(Hz) |
Vin(V) |
Vout(V) |
Gain(V/V) |
|
0.3 |
0.02 |
0.02 |
1 |
|
1 |
0.02 |
0.076 |
3.8 |
|
3 |
0.02 |
0.148 |
7.4 |
|
5 |
0.02 |
0.172 |
8.6 |
|
6 |
0.02 |
0.182 |
9.1 |
|
6.5 |
0.02 |
0.188 |
9.4 |
|
7 |
0.02 |
0.2 |
10 |
|
7.5 |
0.02 |
0.2 |
10 |
|
10 |
0.02 |
0.2 |
10 |
|
100 |
0.02 |
0.2 |
10 |
|
1000 |
0.02 |
0.2 |
10 |
|
10000 |
0.02 |
0.2 |
10 |
|
20000 |
0.02 |
0.2 |
10 |
|
30000 |
0.02 |
0.148 |
7.4 |
|
40000 |
0.02 |
0.116 |
5.8 |
|
55000 |
0.02 |
0.098 |
4.9 |
|
70000 |
0.02 |
0.084 |
4.2 |
|
90000 |
0.02 |
0.07 |
3.5 |
|
200000 |
0.02 |
0.042 |
2.1 |
|
250000 |
0.02 |
0.036 |
1.8 |
|
1000000 |
0.02 |
0.03 |
1.5 |
|
2500000 |
0.02 |
0.024 |
1.2 |

Figure 23
Current
Draw at Quiescent
Conditions

Figure 24
Slew
Rate

Figure 25
![]()
Summary
of Experimental Results
Table 4
|
Design
Requirement |
State |
|
Gain of 10 V/V |
10 V/V |
|
Drive a 1k Load |
Confirmed |
|
Input Resistance > 50kΩ |
51K |
|
Largest Output Swing Possible |
~3 V |
|
Pass 100 Hz Signal |
Confirmed |
|
9V Power Supply |
Confirmed |
|
Draw No More Than 1mA Under Quiescent Conditions |
0.5817mA |
|
Slew Rate |
|
The required desired requirements of the voltage amplifier
were met on both a LTspice model and an implemented
circuit on a breadboard.
Return to EE
420L Spring 2019 Page
Return to Dr. Baker’s CMOSedu homepage
