Lab 8 - EE
420L: Engineering Electronics II
04/062017
In this lab you
will characterize the transistors in the CD4007 and generate SPICE Level=1
models. Assume that the MOSFETs will be used in the design of circuits powered
by a single +5 V power supply. In other words, don't characterize the devices
at higher than +5 V voltages or lower than ground potential.
Experimentally generate, for the NMOS
device, plots of:
1.
ID v. VGS (0 < VGS < 3 V) with VDS = 3 V
2.
ID v. VDS (0 < VDS < 5 V) for VGS varying from 1 to 5 V in 1 V
steps, and
3.
ID v. VGS (0 < VGS < 5 V) with VDS = 5 V for VSB varying from 0 to
3 V in 1 V steps.
Note that for this last one, if VSS
(NMOS body) is ground (again, the Body, VB, is grounded) then the source
voltage will be varied from 0 to 3 V in 1 V steps to realize VSB ( = VS - VB = VS) varying from 0 to 3 V in 1 V steps. At the
same time VGS will be varied from 0 to 3 V (when VS = 0), 1 to 4 V (when VS = 1
V), 2 to 5 V (when VS = 2 V), and 3 to 5 V (when VS = 3 V). In other words, as
VS is increased by 1 V the VGS has to shift up by 1 V
as well.
Assuming that the length of the NMOS is
5 um and its width is 500 um calculate the oxide
thickness if Cox (= C'ox*W*L) = 5 pF.
From this measured data create a Level =
1 MOSFET model with (only) parameters: VTO, GAMMA, KP, LAMBDA, and TOX.
Compare the experimentally measured data
above (the 3 plots) to LTspice-generated data (again,
3 plots) and adjust your model accordingly to get better matching.
Repeat the above steps for the PMOS
device where VDS, VGS, and VSB are replaced with VSD, VSG, and VBS
respectively.

*LT Spice Models*
Experiment 1:
Calculated Values for the CD4007 Level = 1 model can be seen below in
figure 1. The initially calculated values resulted in the following values.
These values resulted in simulation waveforms that closely match the
experimental waveforms.

Figure 1
NMOS
ID v. VGS (0 < VGS < 3 V) with VDS = 3 V. The simulated waveform
using the CD4007_models.txt file is seen below followed by the experimental
results. This is closely matched to the experimental waveforms seen below in
figure 2.

Figure 2
As can be seen I have adjusted my level 1 models to match the simulation
results, the threshold voltage is near 1.5V and the current at 3V through the
10K resistor is about 90uA
ID v. VDS (0 < VDS < 5 V) for VGS varying from 1 to 5 V in 1 V
steps below in figure 3

Figure 3
As can be seen from the experimental results above the currents
calculated using the 10k ohm resister are near the simulated currents.
ID v. VGS (0 < VGS < 5 V) with VDS = 5 V for VSB varying from 0 to
3 V in 1 V steps below in figure 4

Figure 4
The simulation results are not as expected, I expected the threshold
voltage to increase substantially over the 3V sweep. As can be seen in the experimental results
the threshold voltage at 3V VB is nearly 4V.
I am unsure why my simulation results did not work.
PMOS
ID v. VSG (0 < VSG < 3 V) with VSD = 3 V seen below in figure 5.
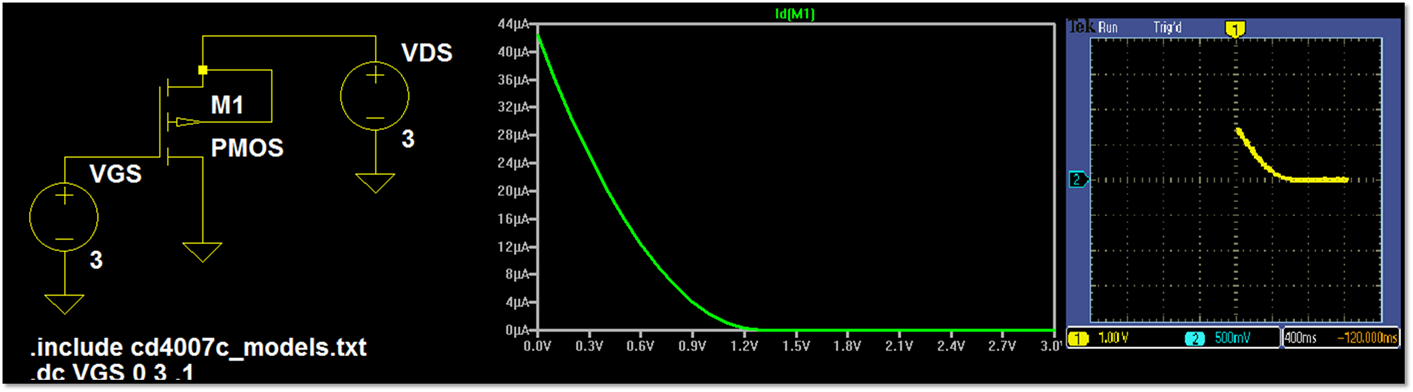
Figure 5
As can be seen the level 1 model for the PMOS nearly matches the
simulated result.
ID v. VSD (0 < VSD < 5 V) for VSG varying from 1 to 5 V in 1 V
steps seen below in figure 6

Figure 6
The current in the simulation results do not appear to be correct, I need
to revisit this experiment to determine what was incorrect. I believe I lost the picture taken to
represent the current, this is probably the base voltage sweep experimental
results. **NEEDS UPDATED**
ID v. VSG (0 < VSG < 5 V) with VSD = 5 V for VSB varying from 0 to
3 V in 1 V steps seen below in figure 7

Figure 7
As before with the NMOS the PMOS simulation results are not what I
expected, I expected to threshold voltage to change significantly as is the
case with the experimental results.
Experiment 2:
Experimentally,
similar to what is seen on the datasheet (AC test
circuits seen on page 3 of the datasheet), measure the delay of an inverter
using these devices (remember the loading of the scope probe is around 15 pF
and there are other stray capacitances, say another 10 pF).
Using your
model simulate the delay of the inverter and compare to measured results.
Adjust your SPICE model to get better matching between the experimental data
and the measured data.
Below in figure 8 is the Schematic and the results using the original
level one models.

Figure 8
As you can see the time delay is not very close to the data sheet of
35-50ns. Therefore, I increased the KP
values and re-simulated which can be seen below in figure 9.

Figure 9
As can be seen above, these time delays more closely match the data sheet
values. Increasing KP values decreases
the time delay, This is because the devices can source
or sink current quicker.
Below in figure 10 is the experimental results of the inverter time
delays.

Figure 10
Clearly there was something wrong with my experiment, I am showing a time delay of 12us when
I should be in the nano-second range. I probably grabbed the wrong value capacitor
and didn’t think to change it out as I had already spent so much time doing
these experiments, but upon writing this report I believe this to be the case.
CONCLUSION:
This lab has demonstrated how to test NMOS and PMOS devices. As well as generated level 1 models through
testing. I was able to
adjust my level 1 models to match my simulation results with the results from
experimentation. Except for the
threshold voltage simulations when varying the base voltage of the
devices. Additionally the experimental
results for the time delay was no where near the data
sheet values, after
several hours of trying to determine the problem I have decided to revisit the
experiment at a later date to achieve the correct results. I believe I had the wrong value capacitor
during my experiment. This would explain
why my time delay was so far off.
Return to Dr. Baker’s
Course Listings