Lab 1 - ECE 420L 

Authored by Desi Battle, battled@unlv.nevada.edu

01/20/2016


==================================================

Experiment 1

==================================================

file:///C:/Users/DJ/Documents/EE%20420%20and%20L/EE%20420_L/lab1/lab1_exp1_schem.JPG

                    Figure 1.21 circuit diagram


file:///C:/Users/DJ/Documents/EE%20420%20and%20L/EE%20420_L/lab1/lab1_handcalcs_1_mag.JPGfile:///C:/Users/DJ/Documents/EE%20420%20and%20L/EE%20420_L/lab1/lab1_handcalcs_1_phase.JPG

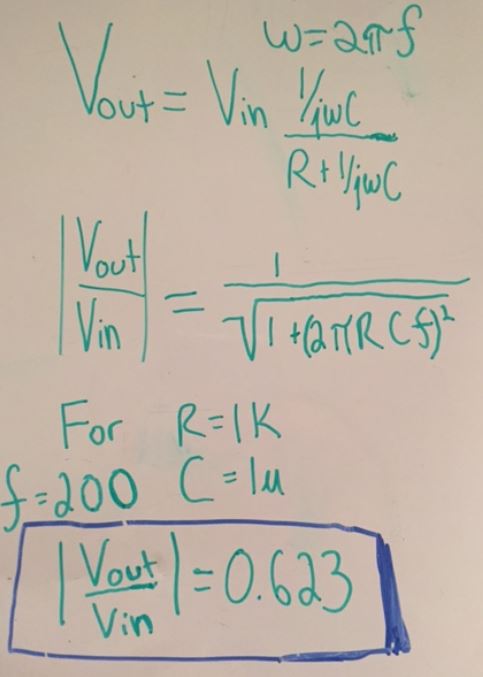
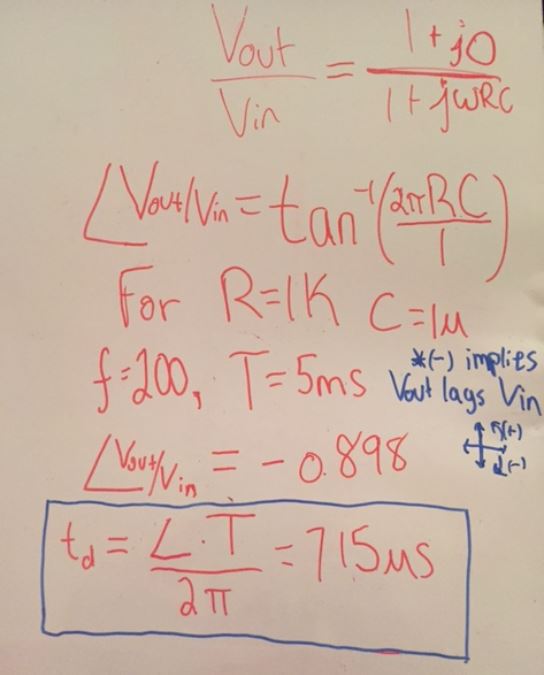
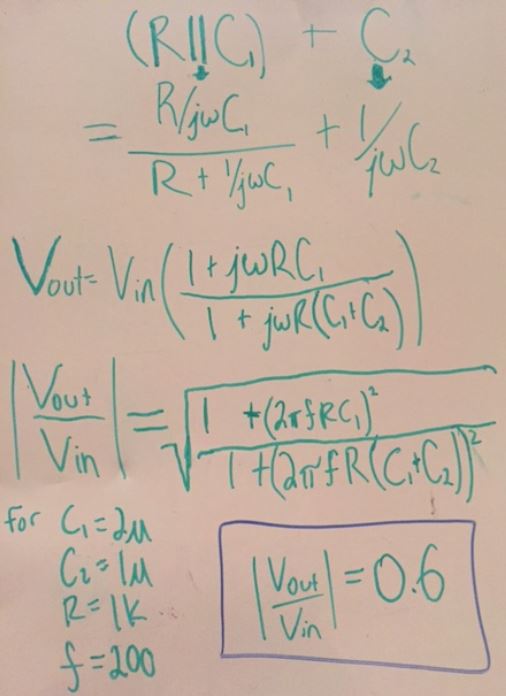
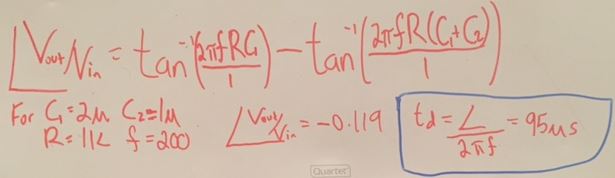
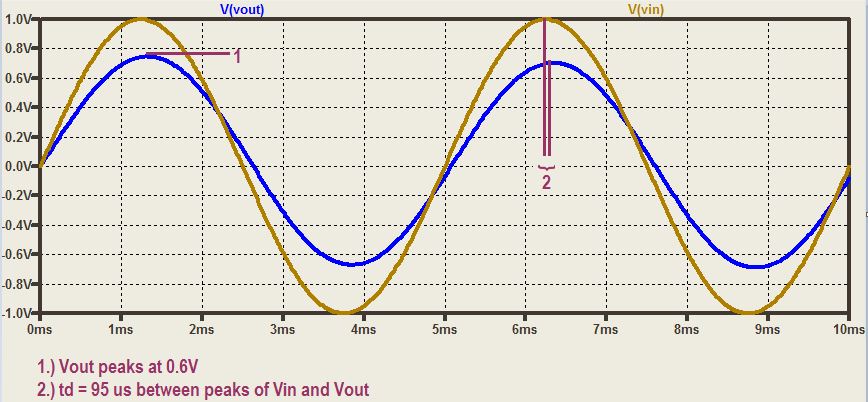
                                      Vouts magnitude (green) and phase shift (red) hand calculations shown above.

file:///C:/Users/DJ/Documents/EE%20420%20and%20L/EE%20420_L/lab1/lab1_exp1_sim.JPG

                SPICE transient simulation waveform showing the same results calculated by hand.


file:///C:/Users/DJ/Documents/EE%20420%20and%20L/EE%20420_L/lab1/lab1_exp1_osc.JPG
                                                 Vout (blue) and Vin (yellow) measured to verify
                                 simulation and hand calculation values

==================================================

Experiment 2

==================================================

file:///C:/Users/DJ/Documents/EE%20420%20and%20L/EE%20420_L/lab1/lab1_exp2_schem.JPG

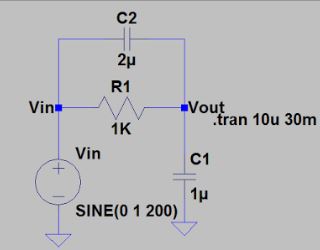
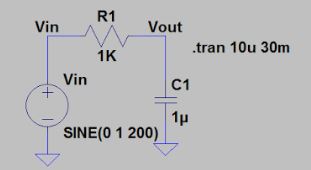
                    Fig 1.22 circuit schematic

file:///C:/Users/DJ/Documents/EE%20420%20and%20L/EE%20420_L/lab1/lab1_exp2_handcalcs_mag.JPGfile:///C:/Users/DJ/Documents/EE%20420%20and%20L/EE%20420_L/lab1/lab1_exp2_handcalcs_phase.JPG

                         Magnitude (green) and phase (red) hand calculations shown above  

file:///C:/Users/DJ/Documents/EE%20420%20and%20L/EE%20420_L/lab1/lab1_exp2_sim.JPG

                         SPICE transient simulation waveform showing the same results calculated by hand.

file:///C:/Users/DJ/Documents/EE%20420%20and%20L/EE%20420_L/lab1/lab1_exp2_osc.JPG

                Vout (blue) and Vin (yellow) measured to verify
                 simulation and hand calculation values

==================================================

Experiment 3

==================================================

file:///C:/Users/DJ/Documents/EE%20420%20and%20L/EE%20420_L/lab1/lab1_exp3_schem.JPG

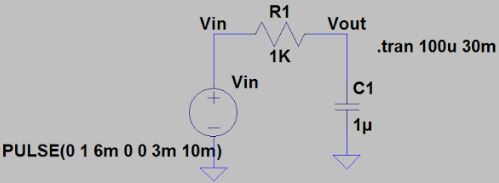
                    **Note: Due to 1uF being used rather than the 1pF, simulation was altered

                          to produce relatively identical waveforms**

file:///C:/Users/DJ/Documents/EE%20420%20and%20L/EE%20420_L/lab1/lab1_exp3_handcalc.JPG

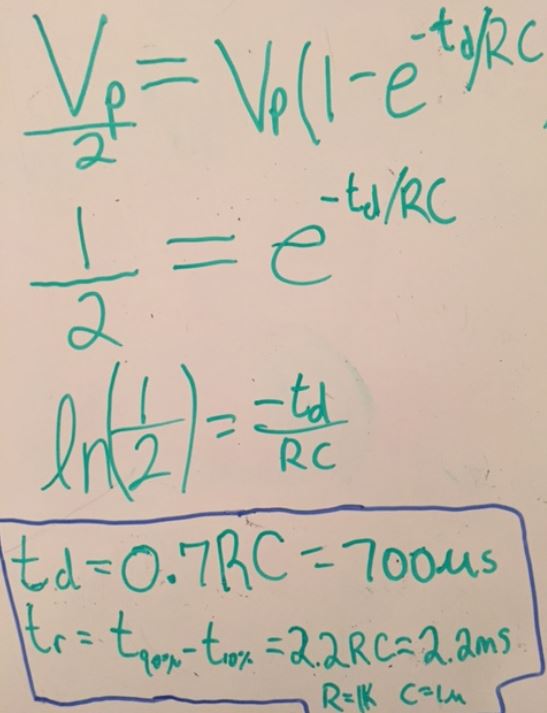
                    Hand calcs to find delay and rise times

                    Only td derivation shown since method

                    for deriving tr is similar

file:///C:/Users/DJ/Documents/EE%20420%20and%20L/EE%20420_L/lab1/lab1_exp3_sim.JPG

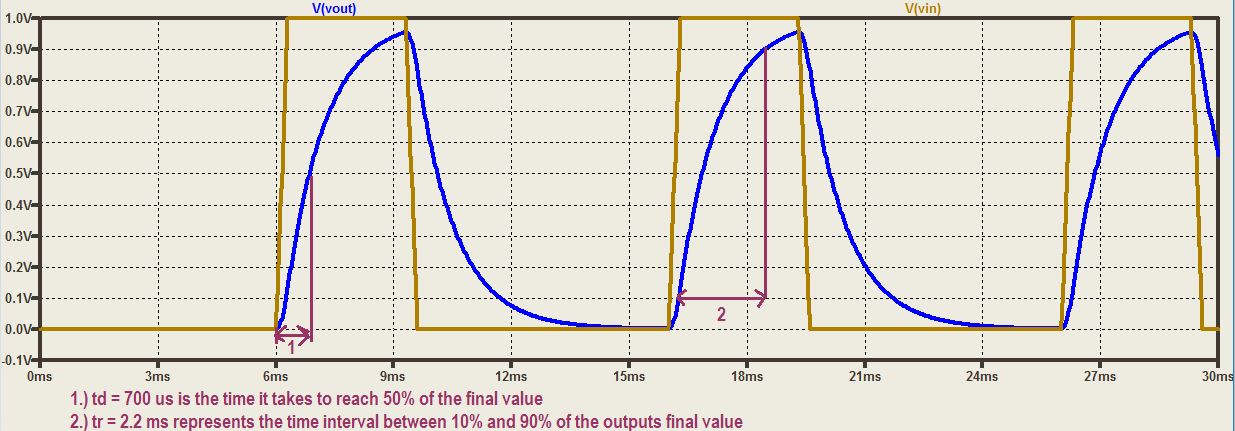
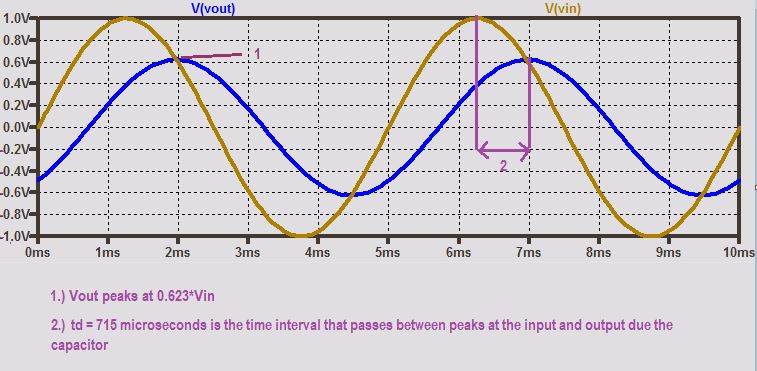
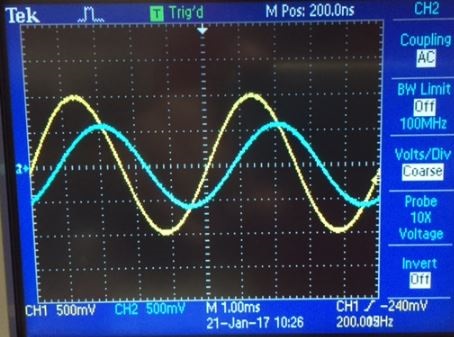
                    Simulation confirming hand calculated results

file:///C:/Users/DJ/Documents/EE%20420%20and%20L/EE%20420_L/lab1/lab1_exp3_osc.JPG

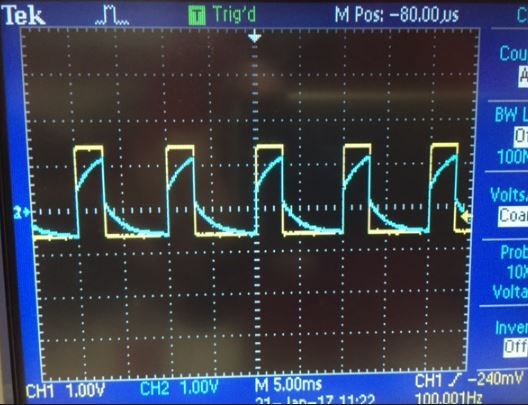
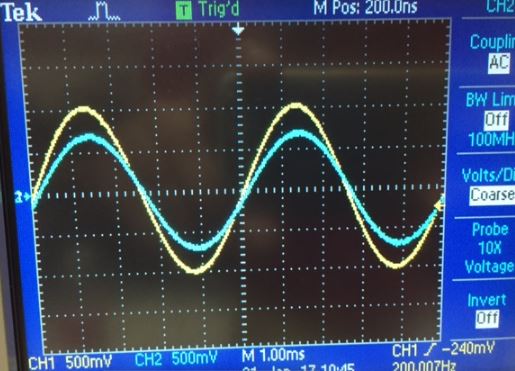
                    Waveform matching simulation results

==================================================

Experiment 4

==================================================

Revisit Fig 1.21 and performig frequency sweep.

file:///C:/Users/DJ/Documents/EE%20420%20and%20L/EE%20420_L/lab1/lab1_exp4_handcalc.JPG

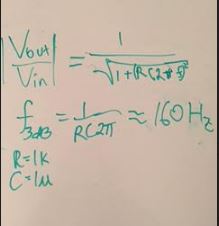
                    f3db calculated by hand. it is the frequency

                    which causes real and imaginary contributions to be equal
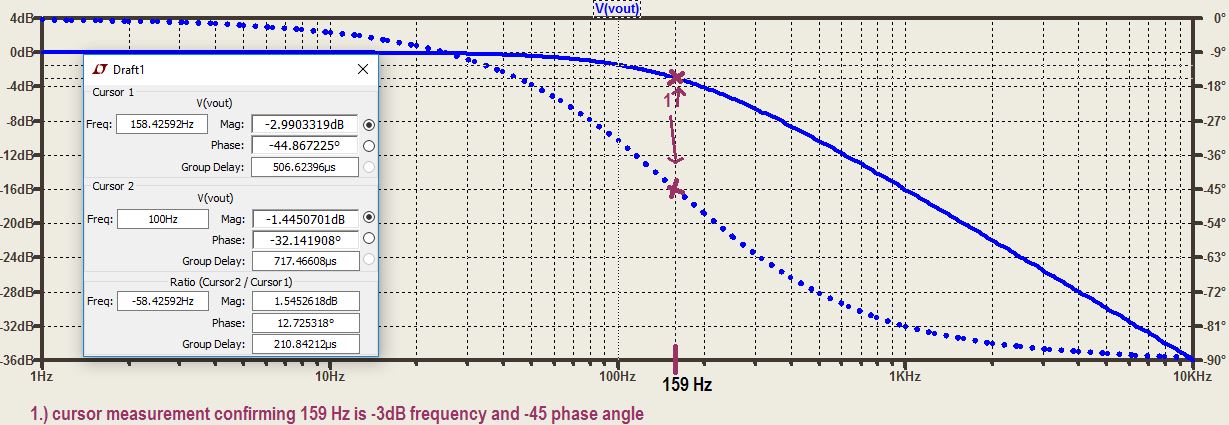
file:///C:/Users/DJ/Documents/EE%20420%20and%20L/EE%20420_L/lab1/lab1_exp4_sim.JPG

Frequency (Hz)Magnitude (Volts)Phase (degrees)(dB)
16100
1600.745-3
1.6K0.190-20

                    Critical values displayed to represent behavior of RC circuit

file:///C:/Users/DJ/Documents/EE%20420%20and%20L/EE%20420_L/lab1/lab1_exp1_showMeasure.JPG

`                        Measurements verifying calculated and simulated results

==================================================

DISCUSSION (main takeaways)

==================================================

From comparing experiment 1 and 2 we see that the adition of a capacitor parallel to the resistor greatly

reduced the phase shift, but did not have much effect on the magnitude.

Experiment 3 showed how a capacitor responds to a sudden change in voltge, specifically examining

the time required to reach critical points when charging.

Experiment 4 reviewed our good friend the frequency sweep.  While transfer functions (Vin vs Vout) are ever popular in

power analysis, Frequency sweeps are used relentlessly in the analysis of systems.

 file:///C:/Users/DJ/Desktop/snippp.JPG

Add a return to the listing of your labs

Retrun to EE 421L Labs