Lab 1 - EE 420L
Authored
by Shada Sharif,
sharifs@unlv.nevada.edu
30 January 2015
Pre-lab work:
- Request a CMOSedu account from Dr. Baker
- Review material on editing webpages
- Read the lab before class
Lab Description:
- Review of basic RC circuits, and analyzing phase, magnitude, and frequency response of the circuit.
Lab Report should include:
- Circuit schematics with values and simulation parameters.
- Hand calculations for the circuit operation.
- Simulation of results using LTspice to verify answers from hand calculations.
- Oscilloscope waveforms to verify both simulation and hand calculation.
- Comments and further potential testing of the circuit that may be useful.
______________________________________________________________________________________________________________________________________________
Experiment #1
The
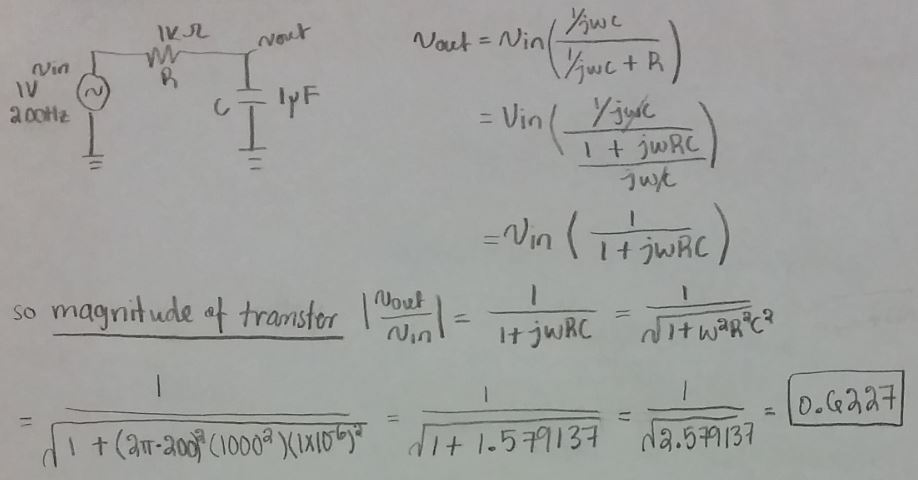
first experiment consisted of a circuit that has a 1k Ohms resistor in
series with a 1µ Farad capacitor. The circuit was powered by a function
generator the supplied a sinusoidal wave with a 1 Volt amplitude and
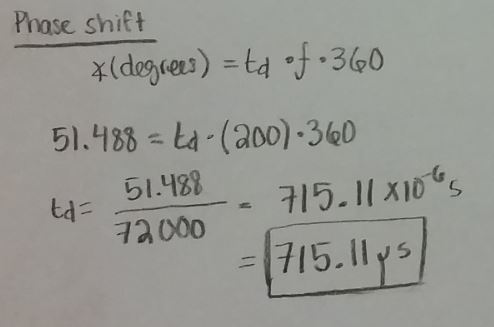
200 Hz frequency. A scope was used to measure the magnitude, phase
response, and phase shift of the circuit. The measurements were done
using to probes where one of the probes measures the input signal, and
the other probe measured the output signal from the junction connecting
the capacitor and resistor. In order to measure the desired values, the
measure and cursors(horizontal and vertical) tools of the scope
were used.
Hand Calculations:
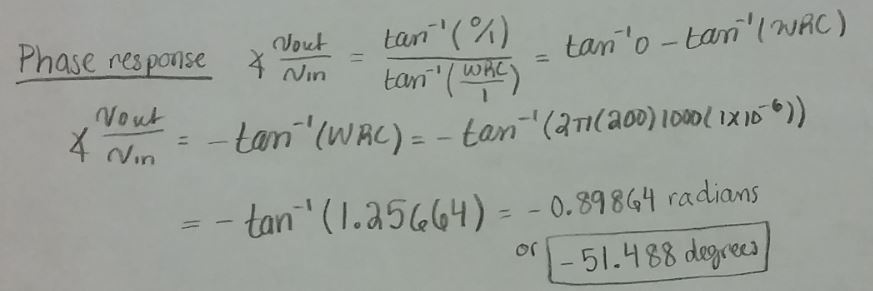
From the hand calculation above, the phase response was calculated
to be negative and this is because the output lags the input and also
due to the circuit being a capacitive circuit.
LTspice Simulation:
The
following simulations were done to verify the hand calculations. The
cursors in LTspice were used to measure the magnitude of the input and
output, as well as the phase shift is shown. The simulation shows that
indeed the hand calculations are correct because they match the
simulation results.


Fig. 1.21 from CMOS Book
Scope Waveforms:


AC Response of the circuit which shows the phase response in the hand calculation matches the simulation.

Comparison between results:
| Magnitude | Phase Shift | Phase Response |
| Hand Calculation | 0.6227 V | 715.1 µs | -51.48 degrees |
| LTspice | 0.6228 V | 712.8 µs | -51.55 degrees |
| Oscilloscope | 0.680 V | 710.0 µs | -51.48 degrees |
Note: the phase response of the oscilloscope was hand calculated and not done using the scope.
The
AC analysis from LTspice shown above could have been also calculated by
collecting data of different frequencies from the oscilloscope. To do
so one varies the frequency of the circuit and record the magnitude and
phase for each frequency accordingly. From the data a plot of
frequency(x-axis) vs. magnitude in decibels(y-axis) can be done for
magnitude response, or frequency (x-axis) vs. phase(y-axis) for
phase response. The following are a set of data recorded:
| Frequency (Hz) | Magnitude (mV) | Magnitude (dB) | Phase (degrees) |
| 50 | 1000 | 0 | -16.2 |
| 100 | 920 | -0.724 | -31.0 |
| 500 | 340 | -9.37 | -72.0 |
| 1000 | 200 | -13.98 | -77.3 |
| 10,000 | 60 | -24.44 | -85.1 |
Overall:
the hand calculation and simulation were very close, but the scope
results were not as close to the other results which may have been due
to the elements used in the circuit. For example, the resistor used was
not a 1k Ohms resistor but a 989 Ohms resistor.
______________________________________________________________________________________________________________________________________________
Experiment #2
The
second experiment is similar to the first one, but the only difference
is that a 2 µF capacitor was added in parallel with the 1K ohms
resistor. The circuit was connected to a function
generator that outputs a sine wave of 1 Volt amplitude and
200 Hz frequency. The magnitude, phase
response, and phase shift of the circuit were measured through using
the cursors of the scope.Two probes were used, one measured the input
signal and
the other probe measured the output signal from the junction connecting
the capacitor and resistor||capacitor.
Hand Calculation:


Again the phase response was calculated
to be negative and this is because the output lags the input and also
due to the circuit being a capacitive circuit.
LTspice Simulation:
The following simulations were
done to verify the hand calculations. The cursors in LTspice were used
to measure the magnitude of the input and output, as well as the phase
shift is shown. The simulation shows that indeed the hand calculations
are correct because they match the simulation results.


Fig. 1.22 from CMOS Book

Scope Waveforms:


Comparison between results:
| Magnitude | Phase Shift | Phase Response |
| Hand Calculation | 0.6935 V | 95.01 µs | -6.841 degrees |
| LTspice | 0.6950 V | 92.26 µs | -6.835 degrees |
| Oscilloscope | 0.7800 V | 100.0 µs | -6.841 degrees |
Overall:
the results of the experiment were very close and varied only in the
scope. This is due to the elements rating of the circuit and the actual
equipments used.
______________________________________________________________________________________________________________________________________________
Experiment #3
The
third experiment has the same circuit from experiment one, but the
input signal to the circuit is changed this time to a step/pulse signal
that has an amplitude of one. The same steps as the first experiment
were done in terms of where the input and output were measured. In this
experiment one notices how the capacitor charge and discharge as the
signal increase and decrease from 0 to 1V. When the signal is
increasing to one, the capacitor is charging with time RC and as the
signal drop to zero, the capacitor starts to discharge till it gets to
a point that it is almost zero, which means it is fully discharges.
Capacitors take 5(RC) to discharge fully. The RC of the circuit here is
(1000)*(0.000001)= 1 millisecond.
LTspice Simulation:


Scope Waveform:

Hand Calculation:

Overall:
the capacitor did not discharge fully in the experiment like shown in
the scope picture. This is becuase there was not enough time for the
capacitor to completely discharge due to the period of the pulse.
Return