
Lab 8 - EE 420L
1. First, use the CD4007 chip to generate the ID vs VGS with VDS=3V, ID vs VDS with VGS changing from 1 to 5V in 1V steps.
2. Second, generate ID vs VGS with VDS=5V and VSB varying from 0 to 3V in 1V steps.
3. The above steps should be done for both PMOS and NMOS.
4. Calculate the oxide thickness assume COX=5pF=C'ox*W*L,(W=500um, L=5um).
5. Build up the LEVEL=1 MOSFET model with parameters: VTO(threshold voltage), GAMMA, KP, TOX(oxide thickness).
6. Use the SPICE model to generate the above current-voltage curves.
7. Use the inverter in CD4007 to test its propagation delay from low to high, tPLH and from high to low, tPHL. And also get the rising time and falling time.
8. Build up LTspice model to simulate the delays and compare to the measured results. Adjust the SPICE model to get the better matching between measured data and simulation data.
Finally, Don't forget to backup your report and work directory on your computer or dropbox and upload it to the CMOSedu.com for the future study and discussion.
1. Use the CD4007 chip to generate three I-V curves of NMOS and three I-V curves of PMOS. Supply different VGS, VDS VSB ( or VSG, VSD, VBS) and use multimeter to obtain different drain current. Then build up the table in excel and draw these following graghs (follow the steps in this video)
NMOS : Id vs VGS @ VDS =3V
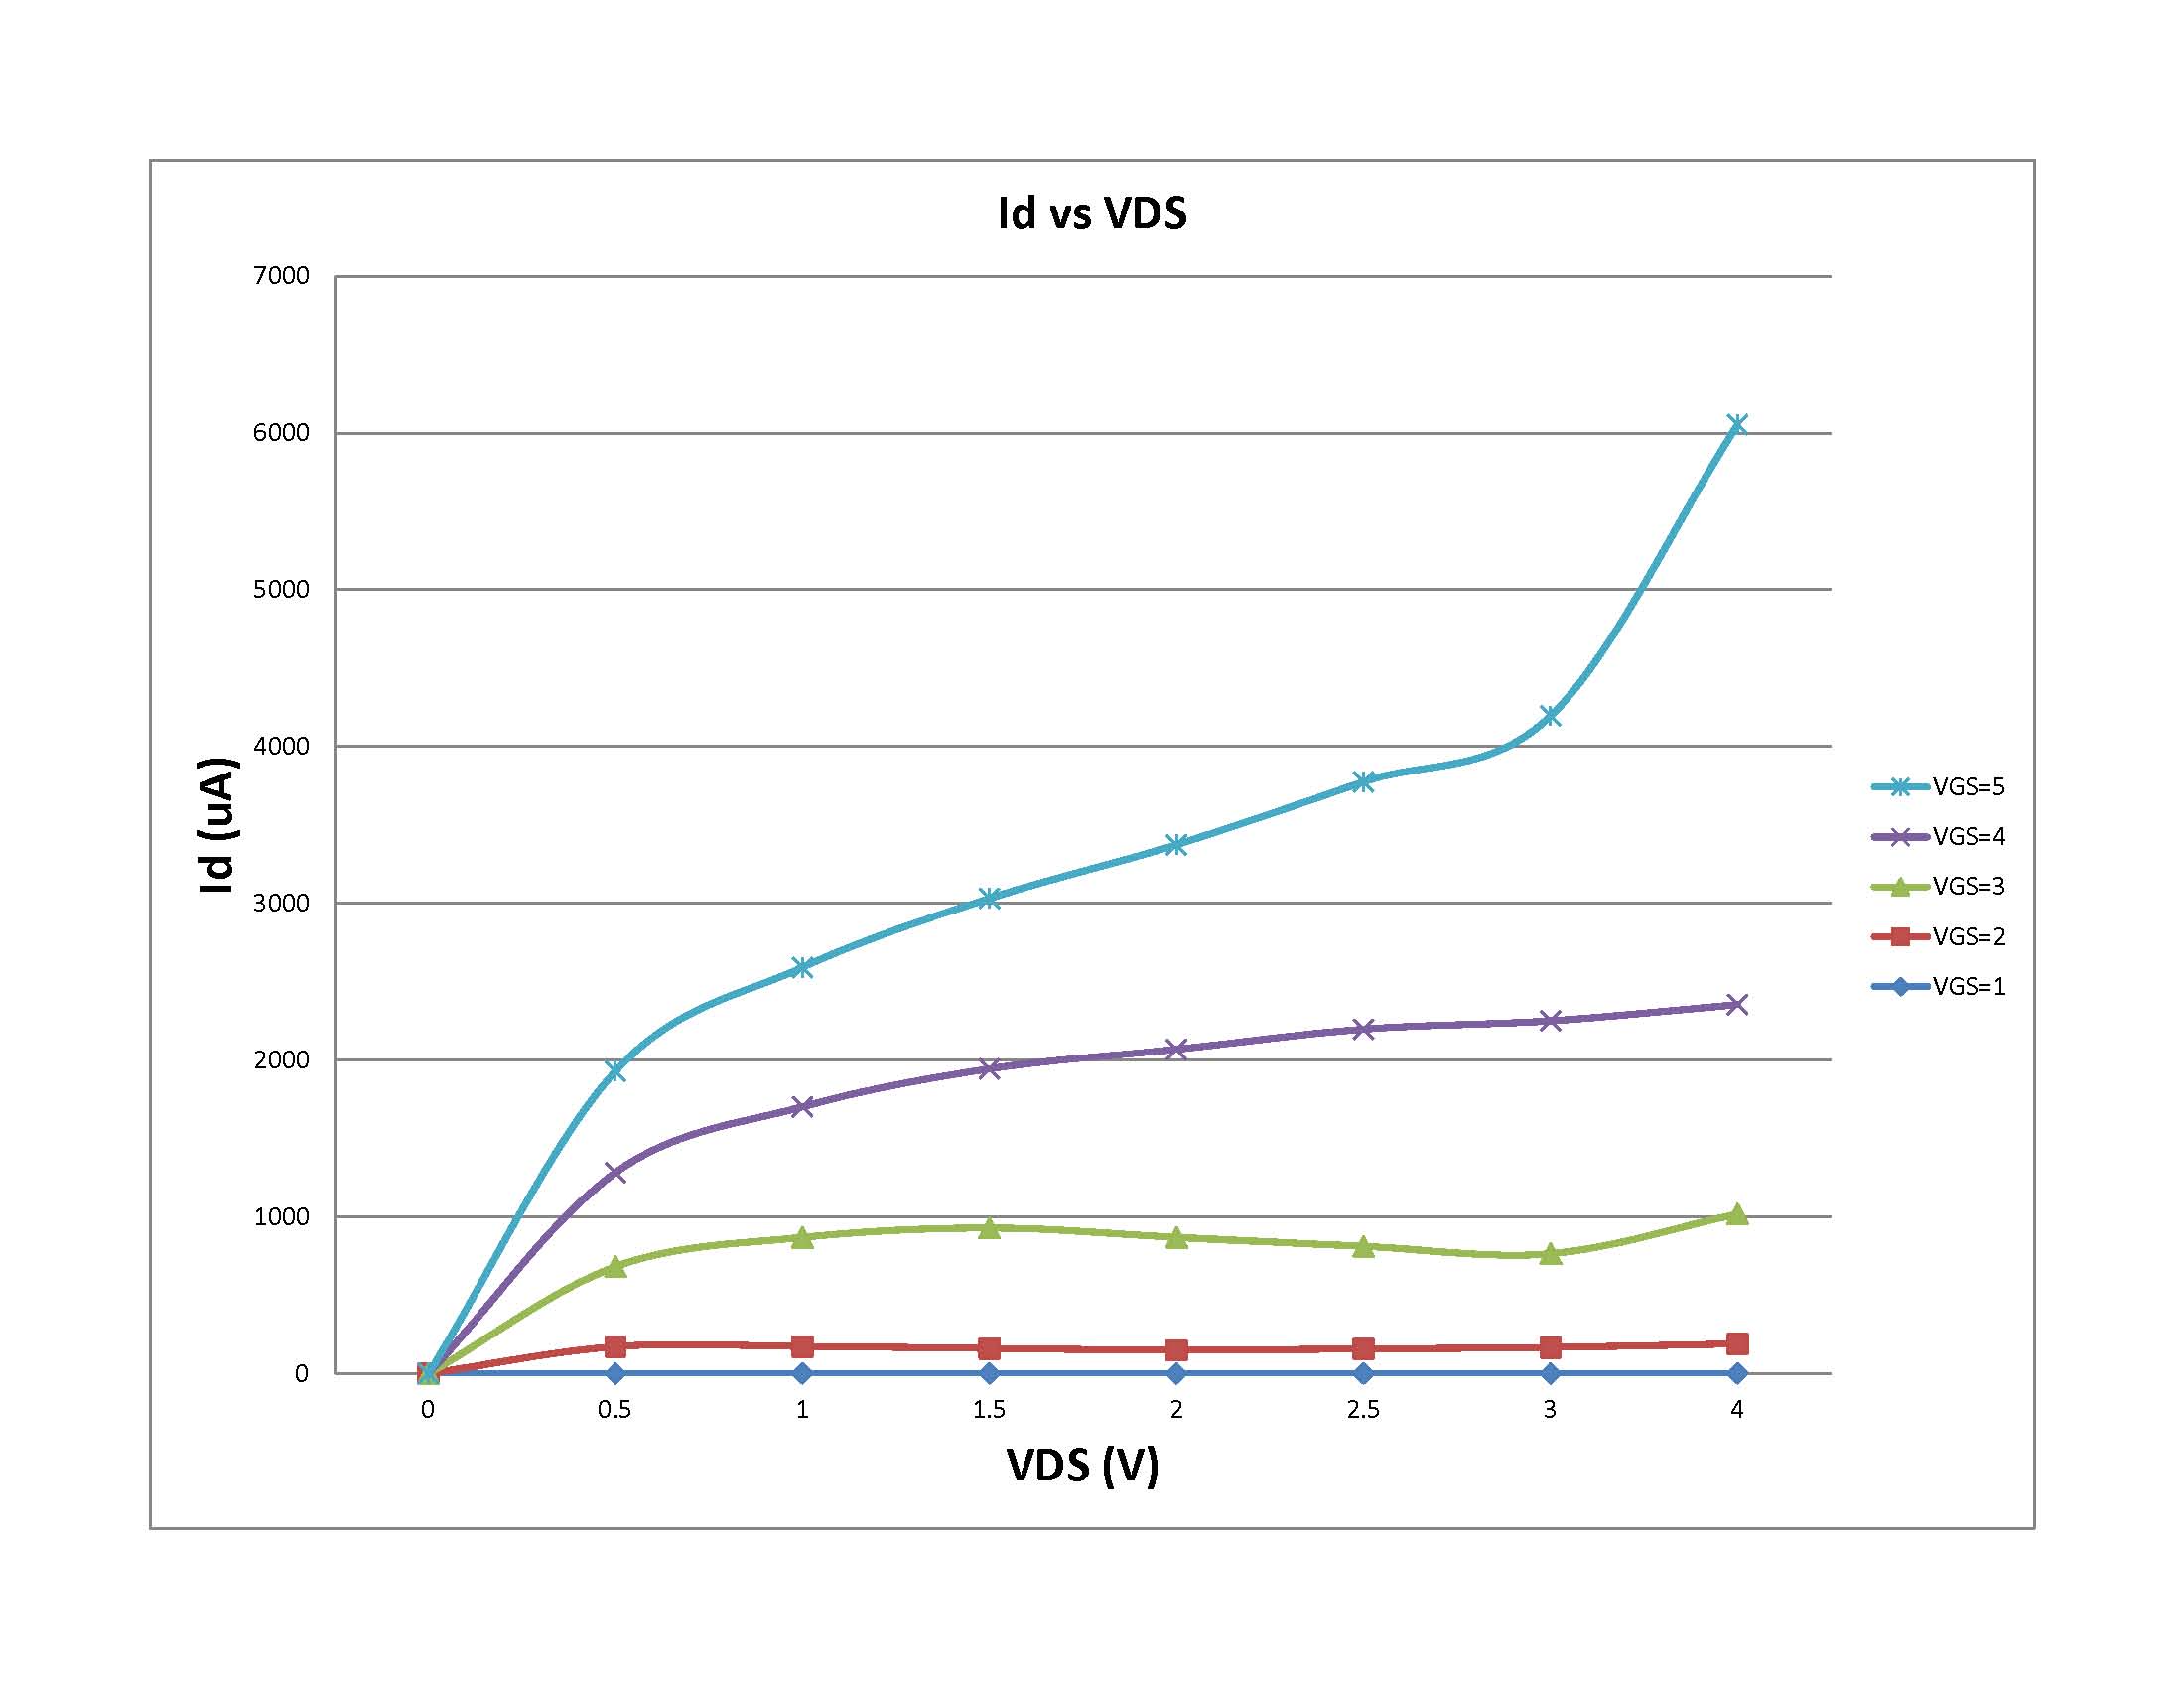
NMOS : Id vs VDS@ changing VGS from 0 to 5
NMOS : Id vs VGS @ changing VSB from 0 to 3V

PMOS : Id vs VSG @ VSD =3V

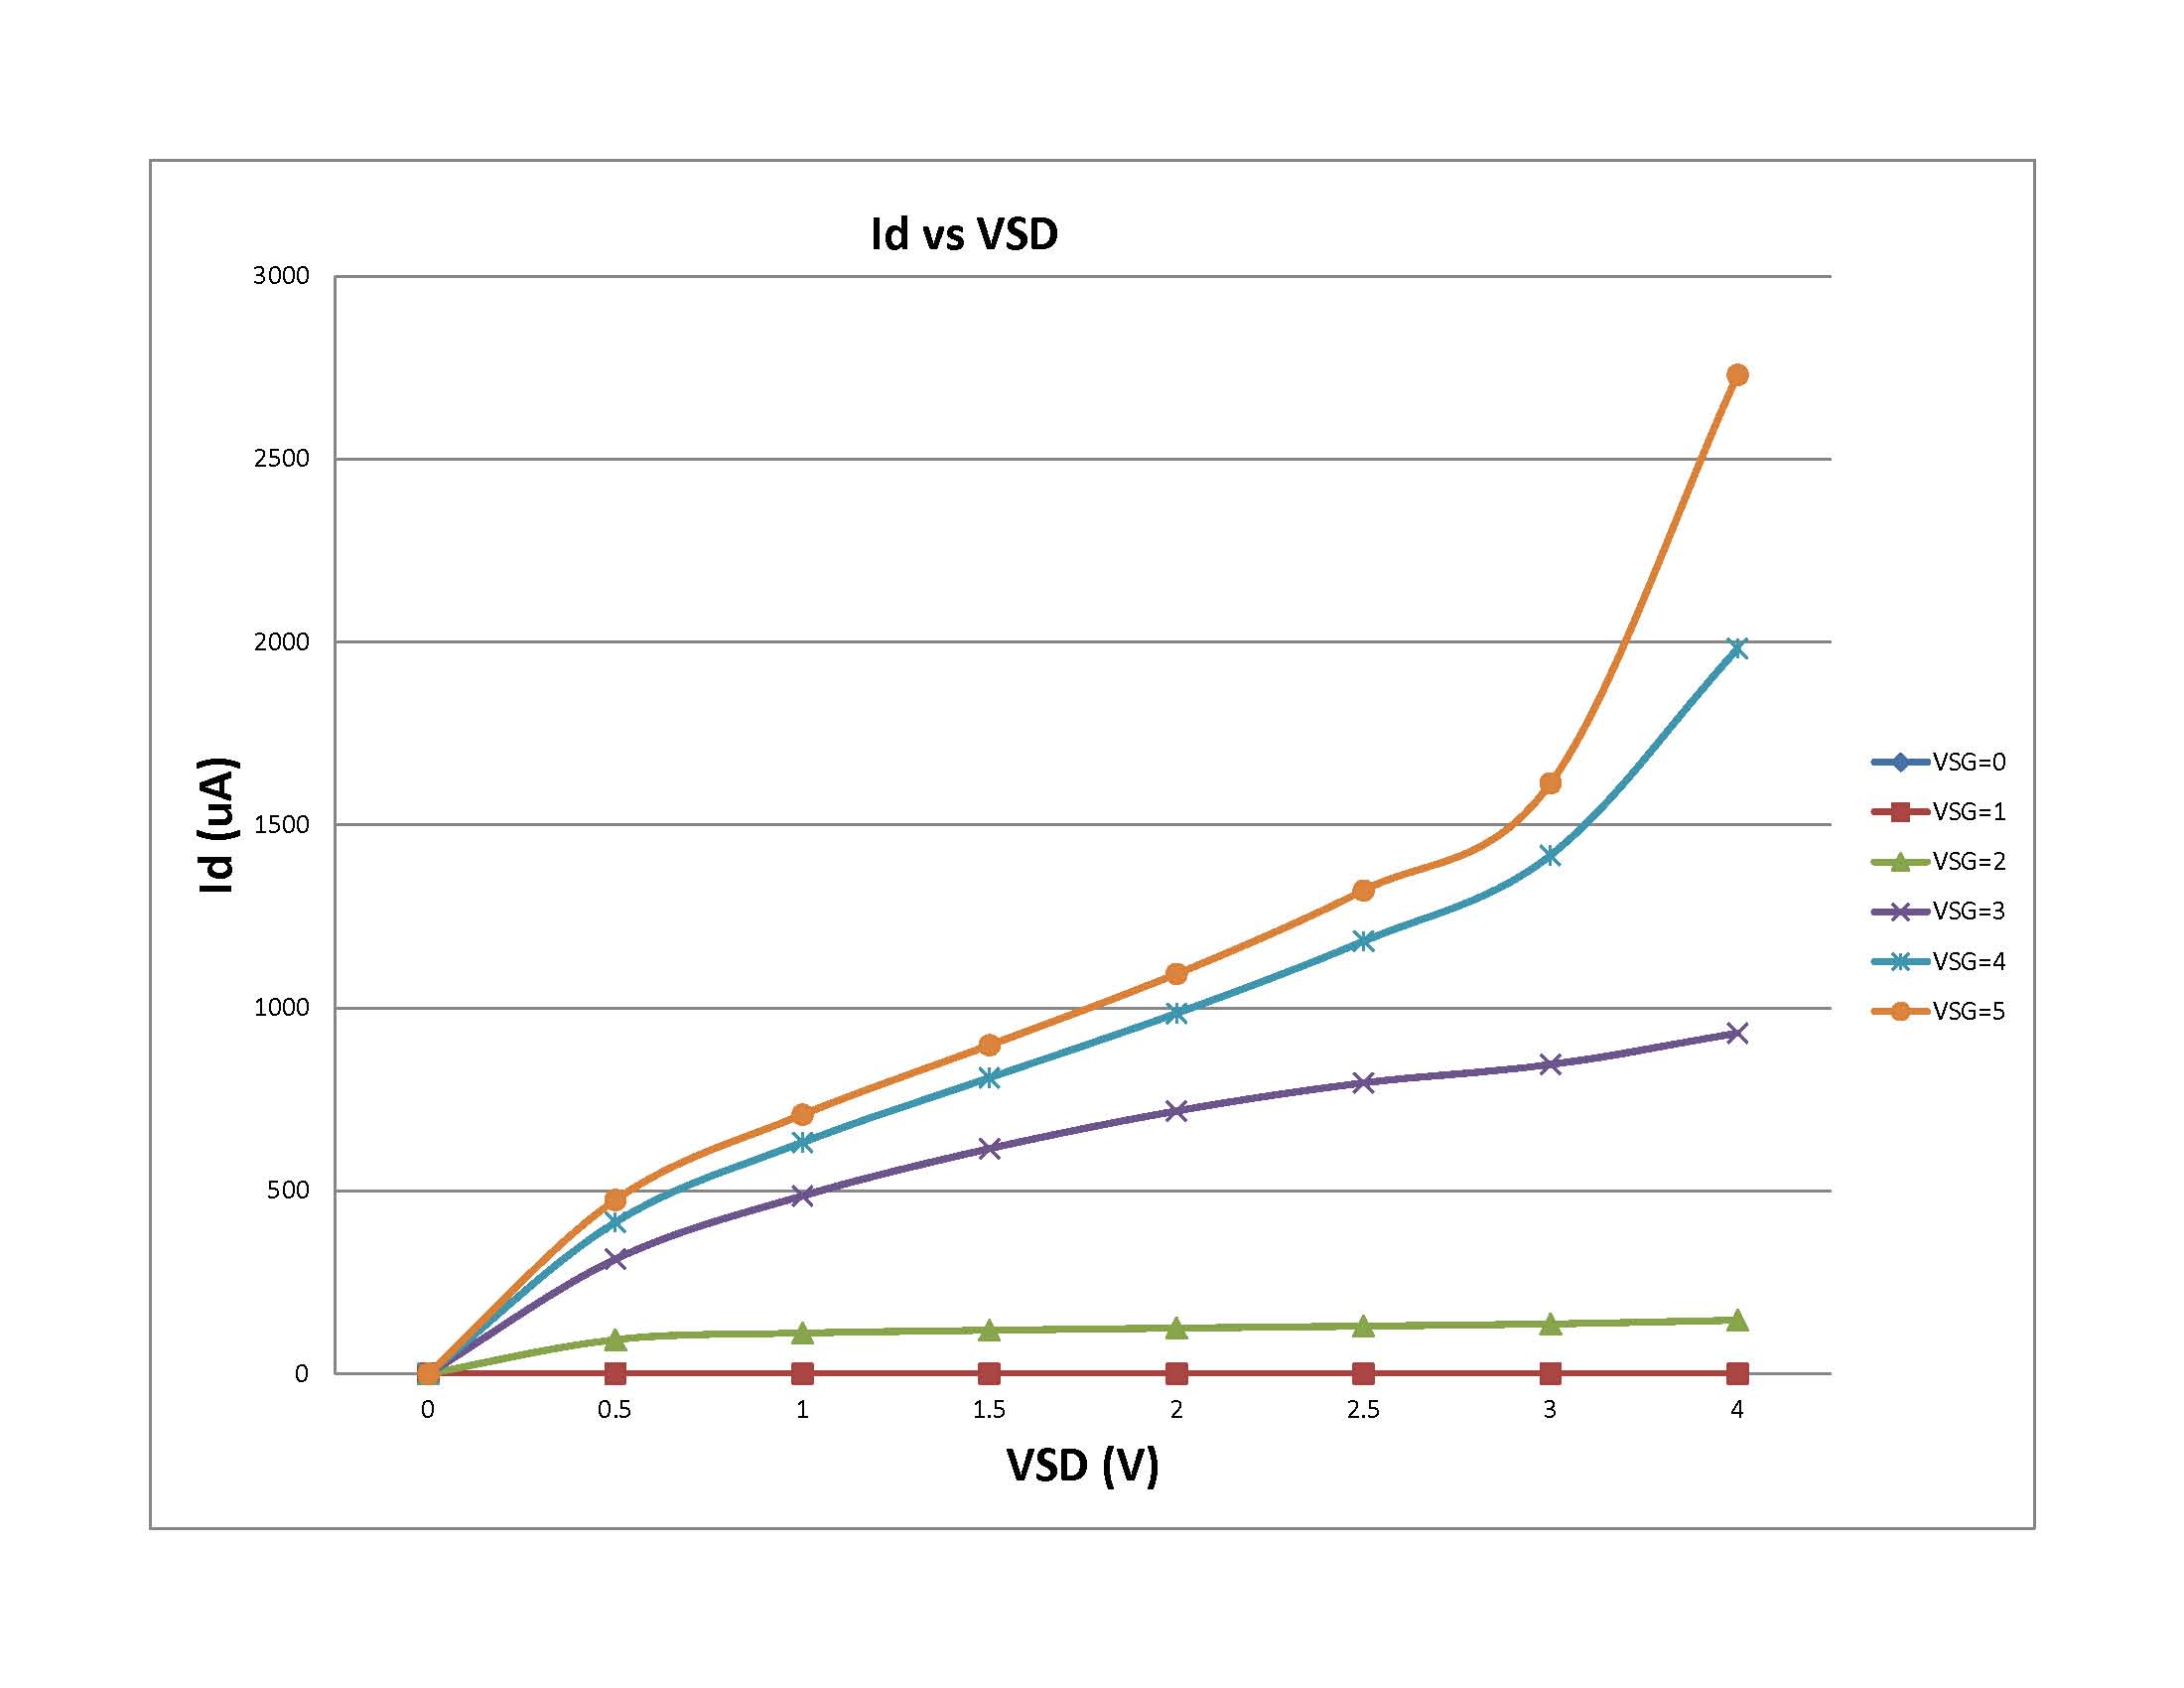
PMOS : Id vs VSD @ changing VSG from 0 to 5V
PMOS : Id vs VSG @ changing VBS from 0 to 3V

2. The oxide thickness TOX= eox/C'ox=3.97e0/(COX/WL)=17.6*10-12 m.
KP(A/V2): KP= C'ox*un*W/L=2*Id/(VDS,SAT)^2
GAMMA(V1/2): On P288, review how to determine the GAMMA.
VTO(V): Based on the measured Id vs VGS result, the threshold voltage of NMOS and PMOS is 1V and 1.5V respectively. VTHN=1V, |VTHP|=1.5V.
PS: All these unites, please review the page 146 of textbook.
3. Based on the calculations, change the values in the MOSFET_model.txt. Then use the model to generate three I-V curves of NMOS/PMOS.
4. Simulate the inverter with one NMOS and PMOS. Please consider the load capacitance, because when design the inverter experimentally, the scope probe has 15pF and there is other stray capacitance, 10pF.
5. Compared the experimental data to the simulation data, adjust the model to match them.
Summary:
From above experiments, we study how to design an audio opamp.