Lab 8 - EE 420L
Authored
by: Roman Gabriele Ocampo
Email: ocampor5@unlv.nevada.edu
Date: May 2, 2014
Characterization of the CD4007 Transistor Array
Prelab:
Lab
Description and Goals:
- In this lab, the SPICE Level=1 models of the CD4007 chip are to be designed experimentally.
- For the NMOS device, experimentally generate plots for:
- ID vs VGS (0<VGS<3V) with VDS=3V
- ID vs VDS (0<VDS<5V) for VGS varying from 1V to 5V
- ID vs VGS (0<VGS<5V) with VDS=5V for VSB varying from 0 to 3V
- From this measured data, create a Level=1 model with (only) parameters: VTO, GAMMA, KP, and TOX.
- Compare the 3 experimentally obtained plots with LTspice generated graphs.
- Experimentally measure the delay of an inverter (similar to what is seen on page 3 of the datasheet).
- Using the model, simulate the delay of an inverter.
- Repeat the above for PMOS (VDS, VGS, and VSB are replaced with VSD, VSG, VBS respectively).
NMOS:
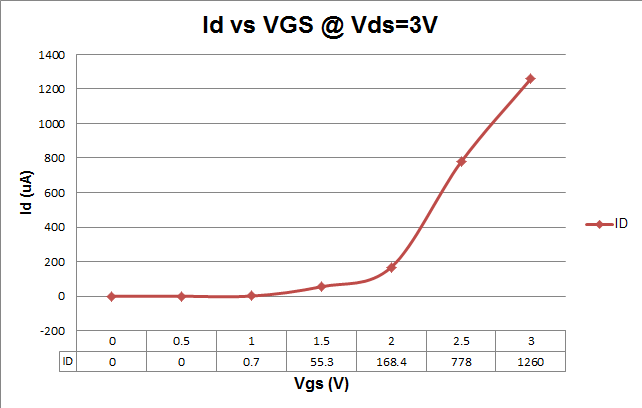
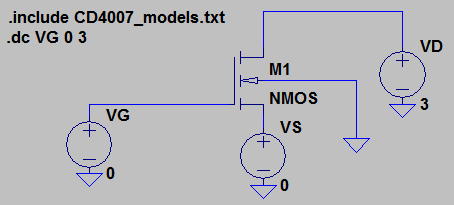
ID vs VGS (0<VGS<3V) with VDS=3V
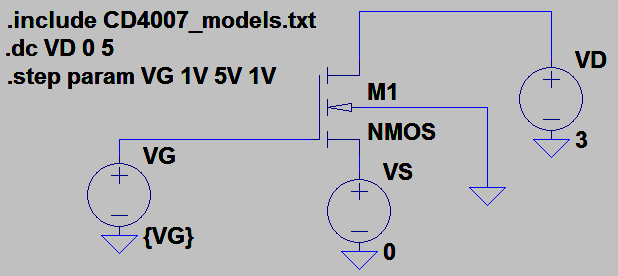
ID vs VDS (0<VDS<5V) for VGS varying from 1V to 5V

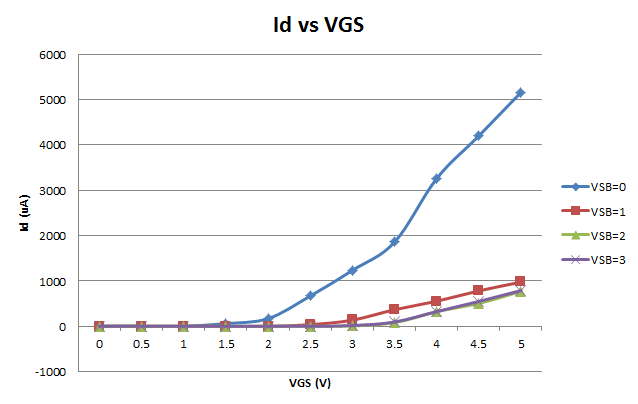
ID vs VGS (0<VGS<5V) with VDS=5V for VSB varying from 0 to 3V
PMOS
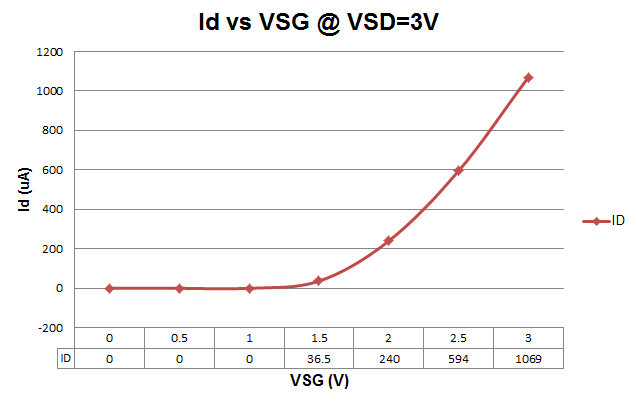
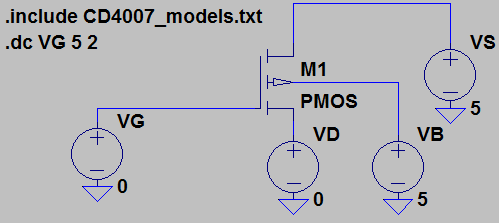
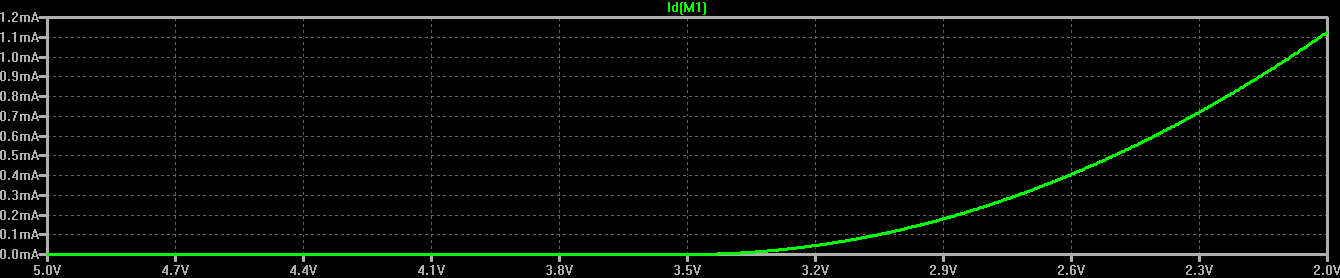
ID vs VSG (0<VSG<3V) with VSD=3V
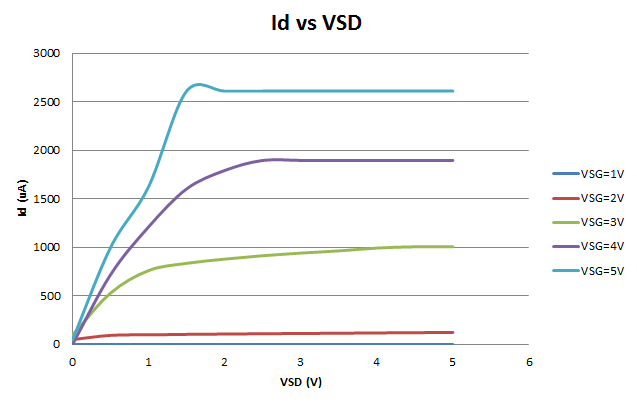
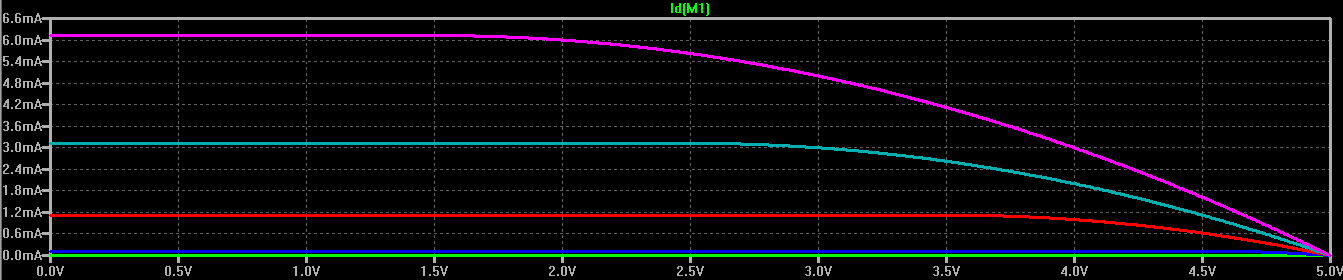
ID vs VSD (0<VSD<5V) for VSG varying from 1V to 5V
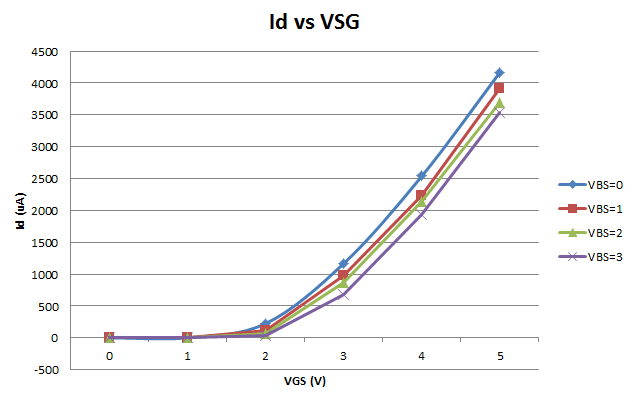
ID vs VSG (0<VSG<5V) with VSD=5V for VBS varying from 0 to 3V
From this measured data, VTO, GAMMA, KP, and TOX can be obtained.
Assume L=5u, W=500u, and Cox=5p.
Tox= eo*er/C'ox = 8.85E-18*3.75 / (5p/(5u*500u)) = 175.7E-10 for both NMOS and PMOS
VTO: Based on the first ID vs VGS (VSG) results, the threshold voltage for NMOS and PMOS is 1V and 1.5V respectively.
KP
= 2*ID / VDSSAT^2: Based on the first ID vs VGS results, and the
VTO above, the KP values for both NMOS and PMOS vary greatly. When the
average is taken, KPn = 600E-6 and KPp = 1000E-6.
GAMMA: Gamma was
approximated by taking the change in threshold voltage divided by the
change in body voltage. Body voltage has a high effect on NMOS, while
it has a negligible one on the PMOS. For an initial estimate, NMOS =0.7
PMOS = 0.2.
The following SPICE Level=1 model assumes these values: CD4007_models.txt
The following circuits and waveforms were obtained:
NMOS
ID vs VGS (0<VGS<3V) with VDS=3V

ID vs VDS (0<VDS<5V) for VGS varying from 1V to 5V

ID vs VGS (0<VGS<5V) with VDS=5V for VSB varying from 0 to 3V


PMOS
ID vs VSG (0<VSG<3V) with VSD=3V
ID vs VSD (0<VSD<5V) for VSG varying from 1V to 5V

ID vs VSG (0<VSG<5V) with VSD=5V for VBS varying from 0 to 3V
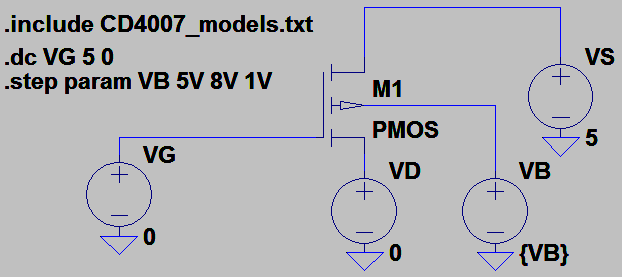

It
is worth noting that the final 2 PMOS sims are reversed because, the
calculation for varying VSG, VS was held constant while VG was
decreased, allowing for a subtraction.
For the next part
of the experiment, the delay of an inverter is obtained. The following
AC test circuit was built (found on the third page of the datasheet).
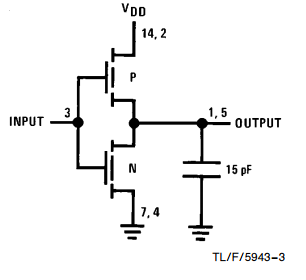
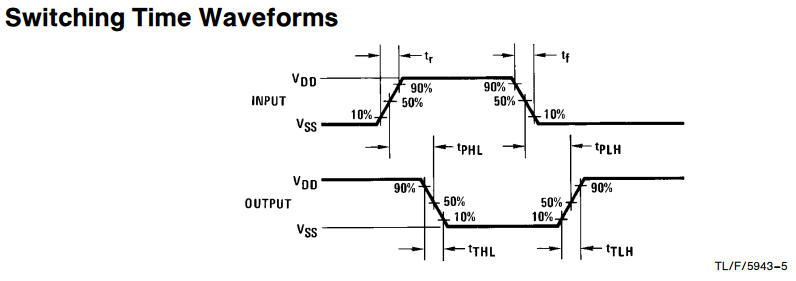
Rise time, fall time, tPHL, tPLH, tTHL, tTLH are to be obtained experimentally, and in simulations.
From the experiment:
Input:
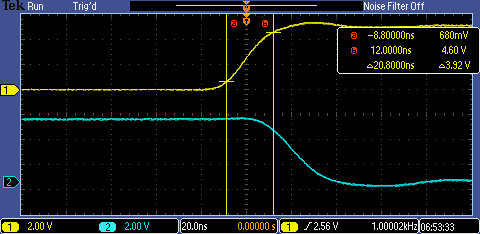
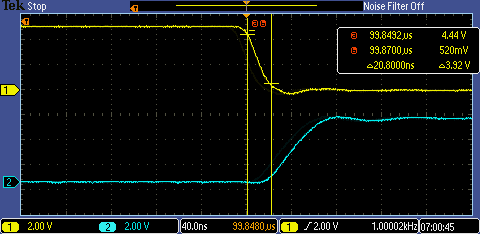
Output:

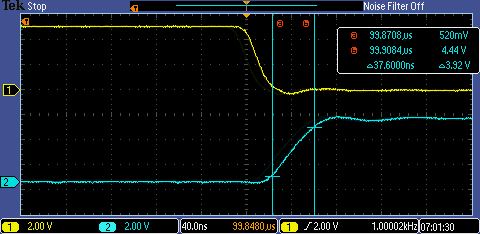
From the above:
tr = 20.8ns
tf = 20.8ns
tTHL = 24.4ns
tTLH = 37.6ns
tPHL = 22.0ns
tPLH = 28.8ns
From LTspice:


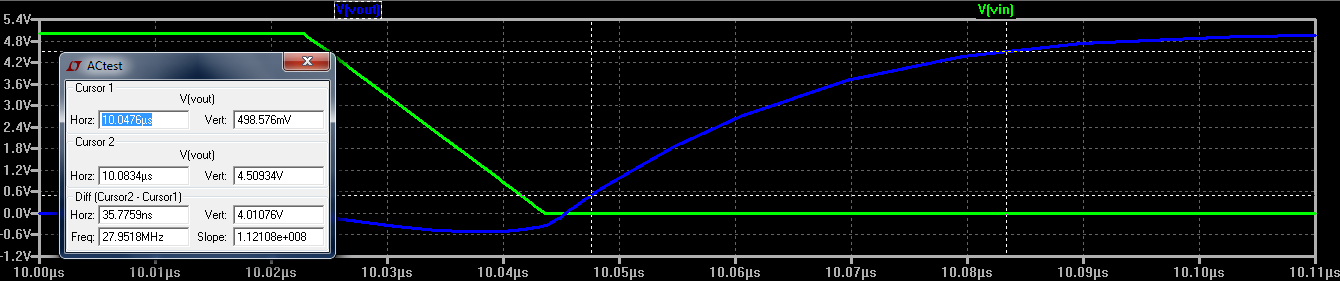
tTHL = 46.15ns
tTLH = 35.78ns
tPHL = 29.6ns
tPLH = 25.9ns
From all the simulated data, we can conclude that CD4007_models.txt
is a decently accurate Level=1 model. However, the body effect plots
are not as accurate as the others, so improvements to the GAMMA
measurement and calculation should be made.
Return to the listing of my labs
Return
to the whole class reports
Return
to the EE420L site
Return to CMOSedu.com