Verilog-AMS
Tutorials using SMASH from CMOSedu.com (Return)
Tutorial
3 – Performing AC simulations
We should preface
this tutorial by stating that to perform an AC analysis in SMASH you
must have
a circuit that generates an AC signal.
This is crucial since if there is no AC signal being
generate SMASH will
not even let you attempt to access the AC analysis function. To avoid any
unnecessary frustration make
sure you are using components that can
and are generating AC values (0 does not count as an AC
stimulus)
1. To test our AC
simulation we first need to
create a circuit that provides an AC stimulus.
For this tutorial we will again use a RC circuit but this
source will be
a sinusoidal (SIN) voltage source.
The
first step is to create a circuit file.
Let’s name this one basic_sim3.
Once
again we are using the same components as the previous tutorial so make
sure
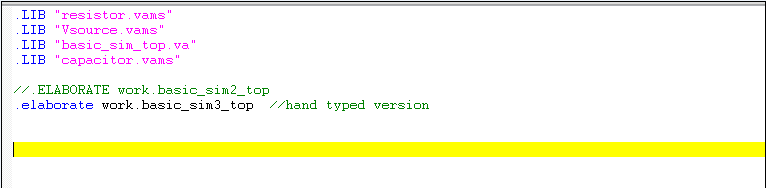
you are adding the proper library (.LIB) component files. You can also type the .ELABORATE command if you have already
decided on what the module
name will be (this is a quick trick if you are constantly using the
same
file. It also
bypasses the step of the
software asking you to select a top level file.
2. Next we will build the
RC circuit. To do
this we need to create a top level module.
Just like in tutorial 2, we can create a new module in a
file that already
contains others. Select
FileàOpen and change the
file type to Verilog
Source files. Then
locate the file
basic_sim_top.va. If
you wish to build a
new file that is fine just refer to the image below for the proper
format of
the module.
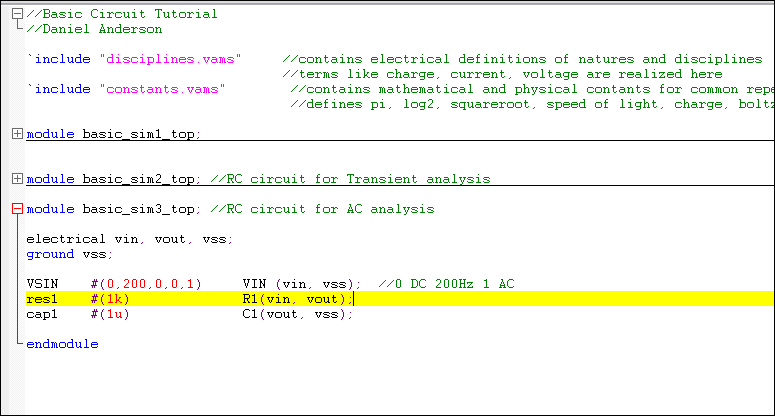
3. The setup is nearly
identical to tutorial 2
except we are using a sinusoidal source.
The parameters needed for this source are the frequency,
amplitude and
AC signal. You will
notice several of
the parameters passed are 0. This
is
because parameters enter on a first come, first served basis. The first parameter passed
automatically
applies to the first parameter in the component module.
In this case the AC component is the last
parameter so we pass 0 to make sure we do not accidentally pass values
to the other
parameters (whose default values are 0).
4. Now go back to the
circuit file. Make
sure that the module has been set as the
top level (.elaborate) and select
AnalysisàSmall SignalàParameters
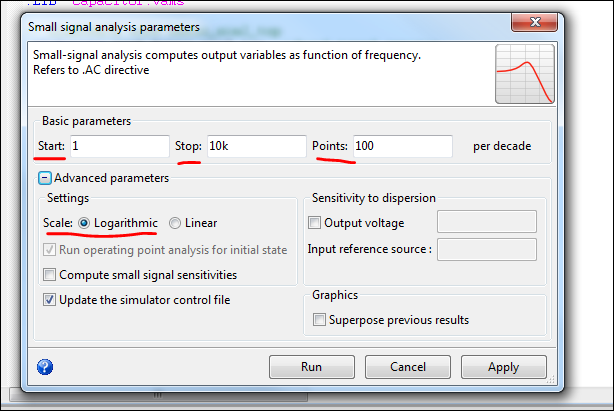
5. The new window that
opens up is where you
set the specifications for your AC simulation.
Just like in the transient simulation you have the option
to Run it
immediately or Apply it so it generates the code equivalent in your
circuit
file. For this
tutorial, let’s generate
a logarithmic (decade) simulation that range from 1 to 10k with 100
points. Select Run
6. Just like in the
transient simulation a
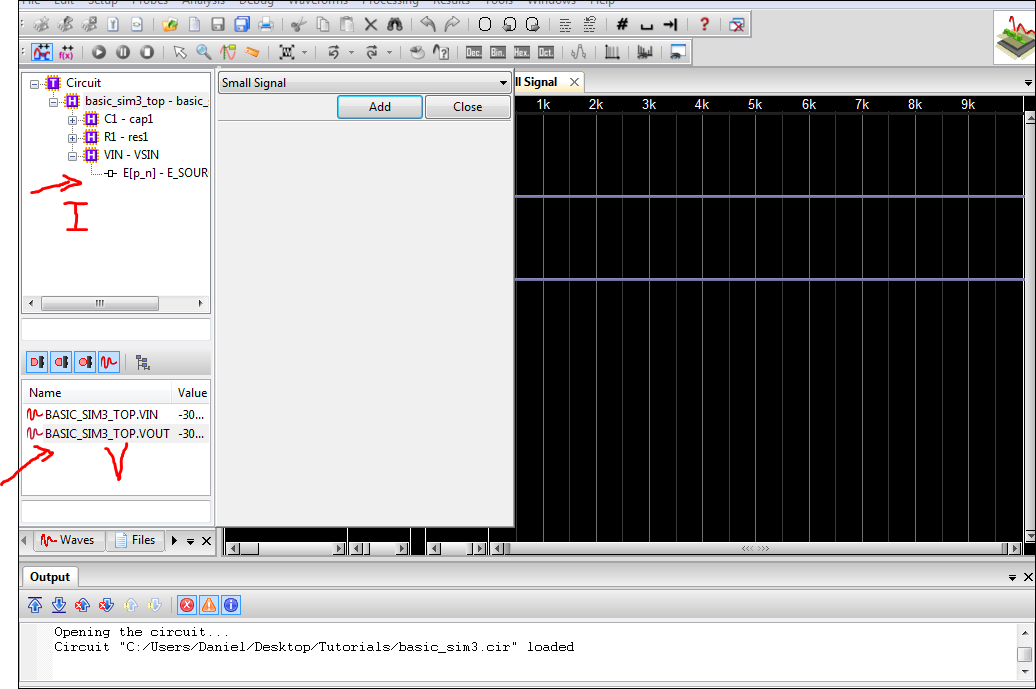
window will appear prompting you for the desired signals to simulate. Remember for current
select the nodes in the
purple squares (expand them so see where current flows through) and for
voltage
select the signals on the bottom (has waveform next to its name). Once you have highlighted
the desired signal
press the Add button to add it to the current simulation. Select Close
once you
are finished.
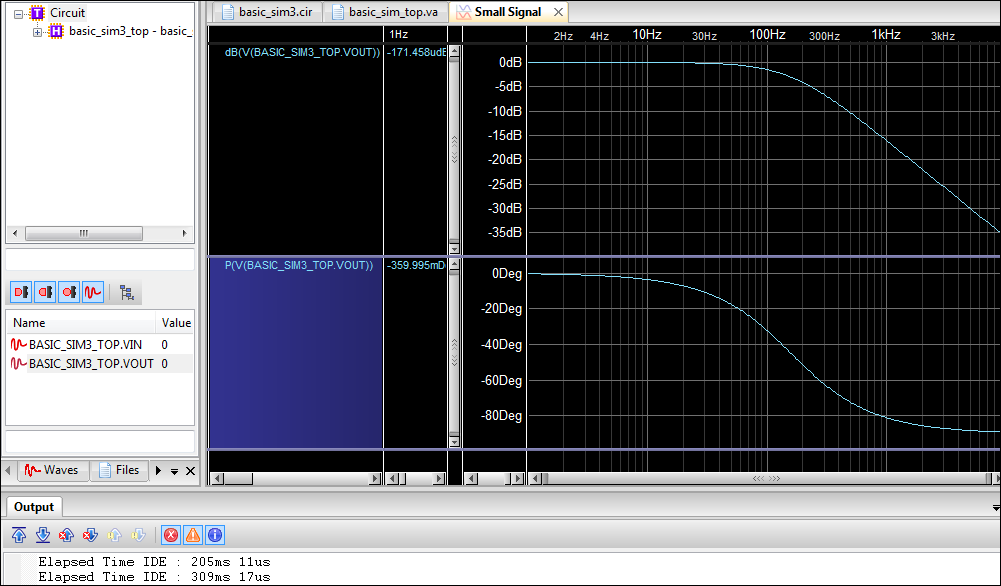
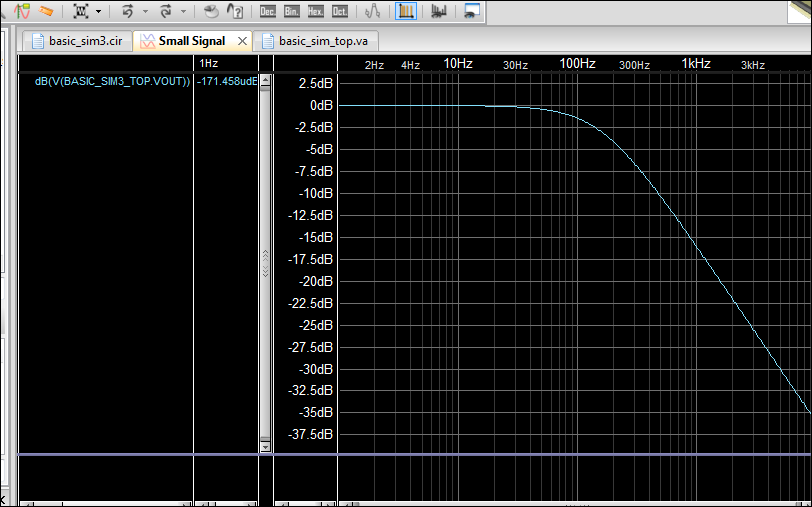
7. By default the data
shown will be in
dB. However, it is
possible to switch to
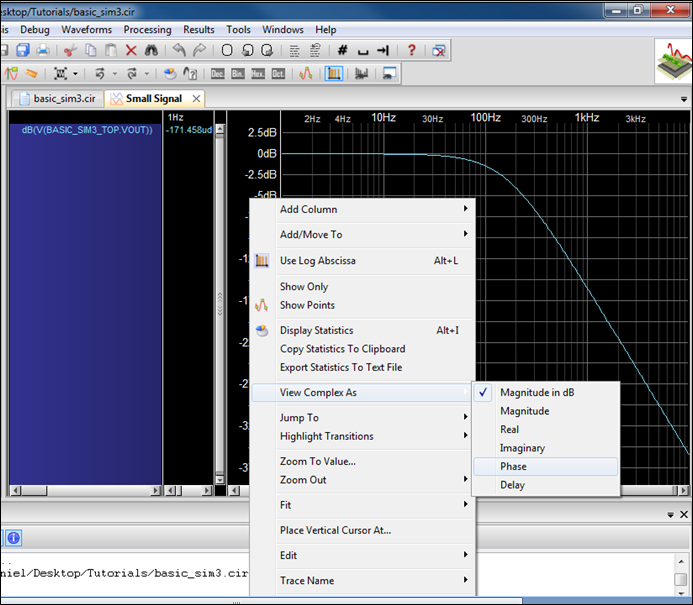
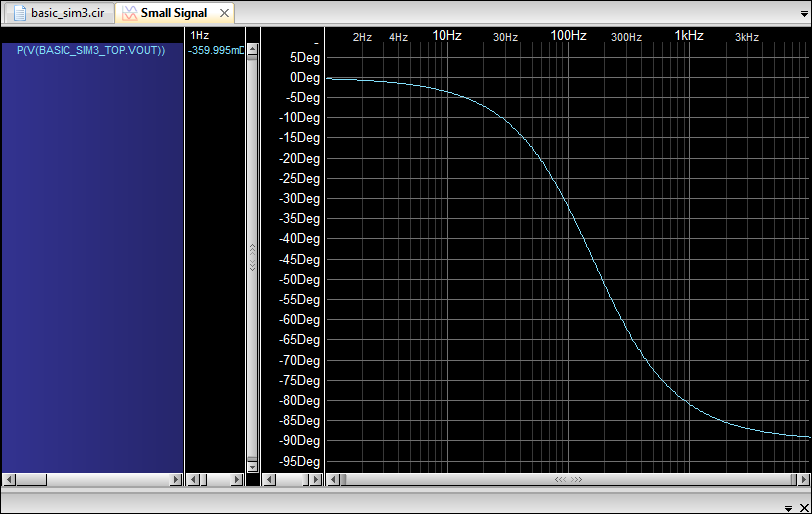
degrees without running the simulation again.
RIGHT-CLICK in the area under the signal and select View Complex
As. A list will
appear show the
different magnitudes that you can view the data in.
Using this tool you can view the signal in
multiple formats.
8. Generally in AC
simulations you want to
plot vout/vin. In
this tutorial our Vin
= 1 so it was not necessary. However,
future cases may not be the same.
To
plot Vout/vin you need to use the Trace Formula window.
Select ProbesàTrace Formula. This
will open a small window on the bottom of the screen.
From here you can mathematically modify your
signals and display them. To
create
vout/vin drag the vout symbol into the box, add a division symbol, and
then
drag the vin symbol into the box after it.
To plot the vout/vin signal you must give it a name in the
white box
directly above it. To
the right of the
box is the type of analysis you are performing.
Make sure it matches the type of analysis you just
performed. If not
change it (in the tutorial it should
be small signal). Lastly
to the left of
the white box is a button that will plot your created formula. Press it and it will print
to the screen.
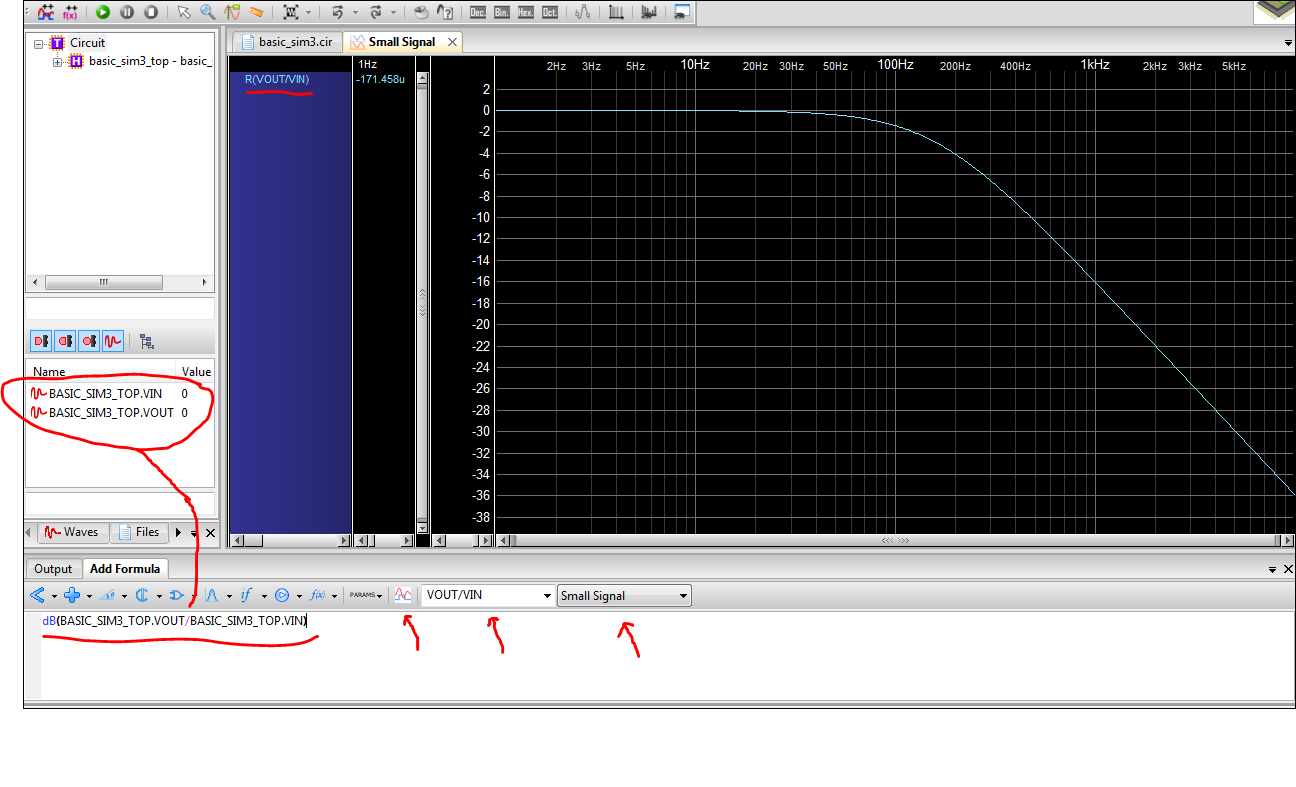
IMPORTANT:
SMASH will not simulate complex formulas. For you to plot vout/vin you must do it in
terms of dB. To accomplish this surround the equation with the dB conversion as seen above.
9. One last useful trick
for AC simulations. Since
you may need to view the data in
multiple formats you can create multiple simulation of the same signal
and then
edit each of them individually. For
example, in this tutorial you may want to view magnitude and phase on
the same
window. To achieve
this just drag and
drop the signals on the left to the space under the current graph
(below the
purple line).