Lab 1 – Review of Basic RC Circuits
EE 420L Analog IC
Lab date: 1/23/18 Due: 1/30/19
By David Santiago – Email: santid4@unlv.nevada.edu
Last Edited on
2/01/19 at 10:07am using Word
---------------------------------------------------------------------------
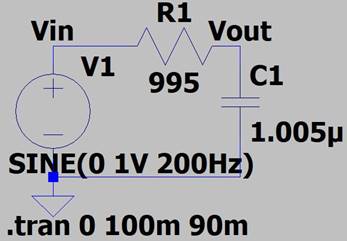
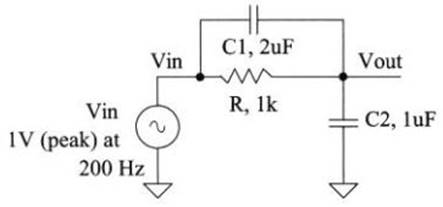
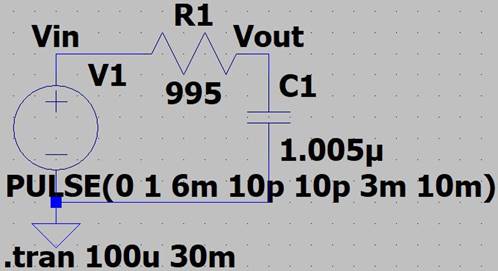
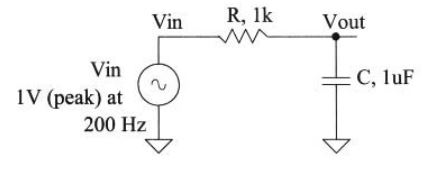
Circuit 1: Fig 1.21 (Page 18)

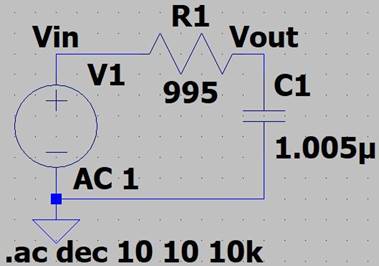
LTSpice:
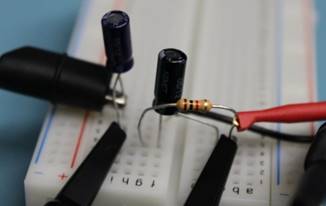
On The BreadBoard:
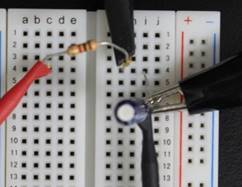
R1: 995Ω, C1: 1.005uF
Theoretical
Hand Calculations:
ZC1 = -j / (2πf *
C1) = -j / [2π (200Hz) * (1.005uF) ]
= -j791.82Ω
Vout = Vin * (ZC1) / ( R1 + ZC1)
= 1V * (-j791.82) / [995 + (-j791.82Ω) ]
|Vout|= ![]() /
/ ![]()
= 0.623 Volts Theoretically
Phase = tan-1(-791.82 / 0) - tan-1(-791.82
/ 995)
= (-90)˚ - (-38.5)˚
= -51.5˚ Theoretically
CMOS Book’s Simulation:
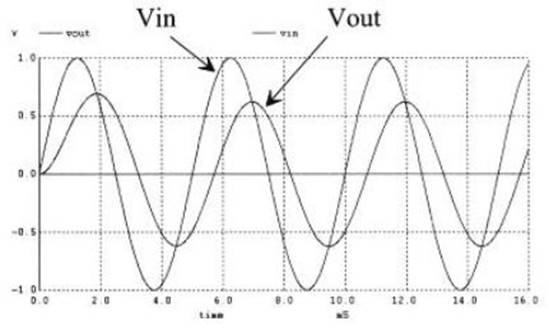
LTSpice Simulation:
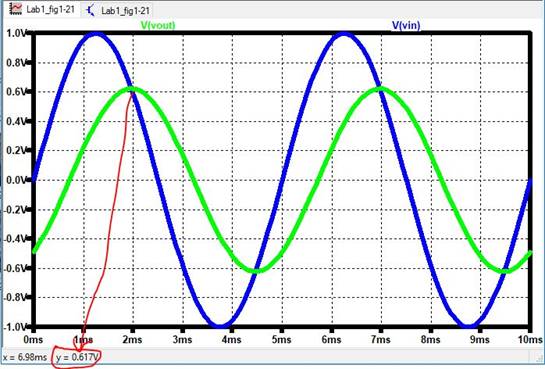
LTSpice
Values:
Vout = 0.617 Volts
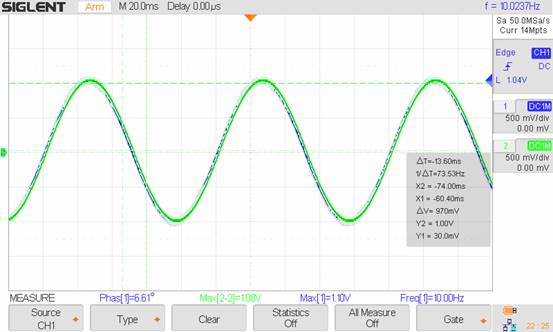
Experimental
Oscilloscope Waveforms:
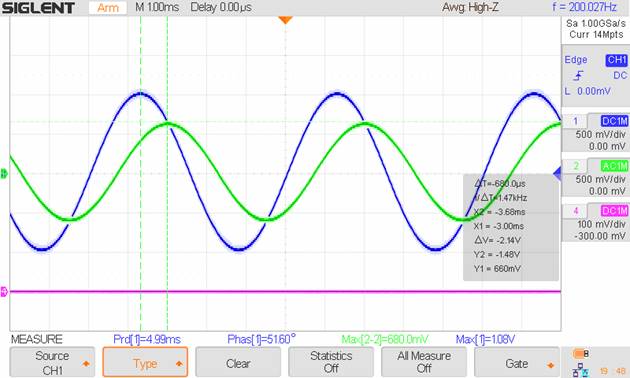
Experimental
Values:
Vin (BLUE) =
1.08V, Vout (GREEN) = 0.680V, Phase = -51.6˚
Observations
& Analysis:
Comparing the theoretical
values from both LTSpice and my hand calculations to the experimental values
from the breadboard, both experimental and theoretical values seem to agree
with each other.
Calculating the percent error
of Vout and phase using : [ (Theo – Exp) / Theo ] * 100%, we have:
Vout % Error = [ (623 – 680) /
623 ] * 100% = 9.1% Error
Phase % Error = [ (51.5 – 51.6)
/ 51.5 ] * 100% = 0.2% Error
-Here we can see that our
voltage output is off by around 10%, and this can be due to one more thing that
hasn’t been taken accout of, and that is the Internal Resistance of the power supply, and since we are dealing
with low voltages, the small resitance inside the supply can affect our
results. Adding a small resistance at the positive supply terminal in our hand
calcs will provide us with a better percent error.
-Also, even though the power
supply says it is outputting 1 Volt, experimentally we are getting to 1.1
Volts, which is theoretically 10% higher than our 1 Volt supply, which sounds a
lot more responsible for the big error.
--------------------------------------------------------------------------------------------
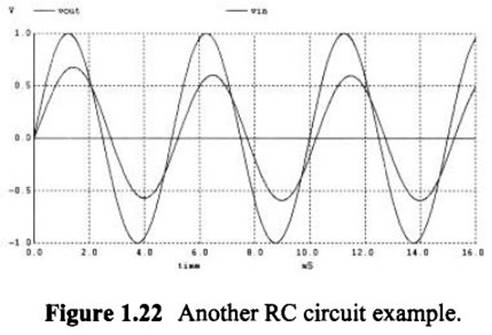
Circuit
2: Fig 1.22 (Page 19)
LTSpice:
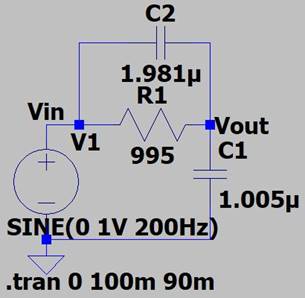
On The BreadBoard:
R1: 995Ω, C1: 1.005uF,
C2: 1.981uF
Theoretical
Hand Calculations:
ZC1 = -j791.82Ω
(From Circuit 1)
ZC2 = -j / (2πf * C2)
= -j / [2π (200Hz) * (1.981uF) ]
= -j401.7Ω
ZR1||C2 = (R1 * ZC2)
/ (R1 + ZC2) = [ 995 * (-j401.7) ] / [ 995 + (-j401.7) ]
= 139.45 – j345.4 Ω
Vout = Vin * (ZC1) / ( ZR1||C2
+ ZC1)
= 1V * (-j791.82) / [(139.45 – j345.4) + (-j791.82) ]
= 0.686 – j401.7Ω
|Vout|= ![]()
= 0.691 Volts Theoretically
Phase = tan-1(-0.084/0.686)
= -6.98˚ Theoretically
LTSpice Simulation:
LTSpice Simulation:
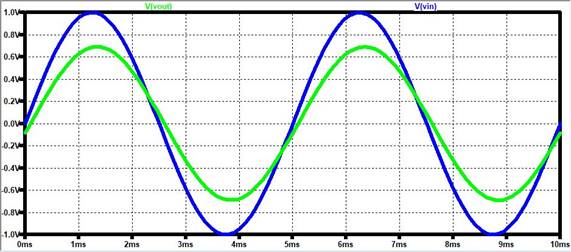
LTSpice
Values:
Vout = 0.689 Volts
Experimental
Oscilloscope Waveforms:
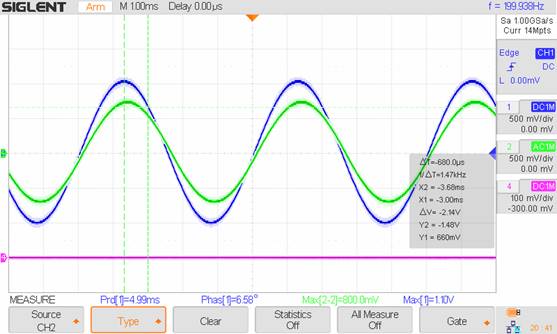
Experimental
Values:
Vin (BLUE) =
1.10V, Vout (GREEN) = 0.80V, Phase = -6.58˚
Observations
& Analysis:
Before we begin to evaluate the
results:
% Error = [ (Theo – Exp) / Theo
] * 100%
Vout %Error = [ (691 – 800) / 691 ] * 100% = 15.8% Error
Phase % Error = [ (6.98 – 6.58)
/ 6.98 ] * 100% = 5.7% Error
-From the values, we have about
a 15% error with our voltage, and this is most likely the result from having a
non-ideal battery source and how the source is about 10% higher than the
theoretical value. There could be a higher parallel capacitance with the
resistor to where all of the AC current goes through the capacitor and can
create that higher voltage potential at Vout.
Our experimental phase shift is
also off by a short margin, however, it is close to the theoretical value and
can be an -acceted value.
-------------------------------------------------------------------------------
Circuit 3: Fig 1.24 (Page 21)
w/Book Output
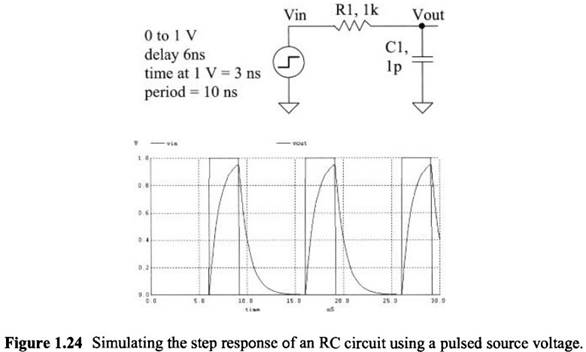
NOTE : Changed 1pF capacitor with 1uF capacitor
LTSpice:
On the Breadboard:

R1 = 995Ω, C1 = 1.005uF
Theoretical
Hand Calculations:
RC Time Constant: T = R*C = 995
*(1.005u) ≈ 1ms
Duty Cycle of Square wave = 30%
of 1/100Hz = 3ms
Charging Formula: Vout = Vin *
(1 – ![]() )
)
Vout = 1V * (1 –
e^(-3m/1m))
Vout = 0.95V Theoretically
LTSpice Simulation:
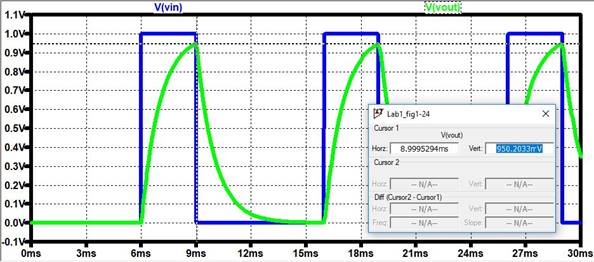
LTSpice
Values:
Vout = 0.95 Volts
Experimental
Oscilloscope Waveforms:
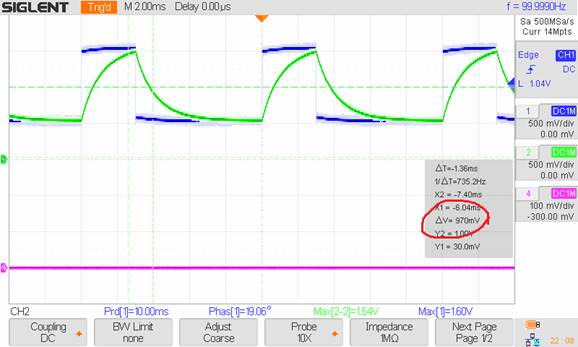
Experimental
Values:
Vin (BLUE) = 1V,
Vout (GREEN) = 0.97V
Vout =
.97V Experimentally
Observations
& Analysis:
% Error = [ (Theo – Exp) / Theo
] * 100%
Vout % Error = [ ( .95 - .97) /
.95 ]*100% = 2.1% Error
From looking at our simple
circuit, we can see that the capacitor is charging and that both the
theoretical and experimental values match. The error could have been that the
charger does not fully discharge at the end and so we charge from somewhere a
bit over .01 Volts and get a small error that we can live with.
-----------------------------------------------------------------------------------------------
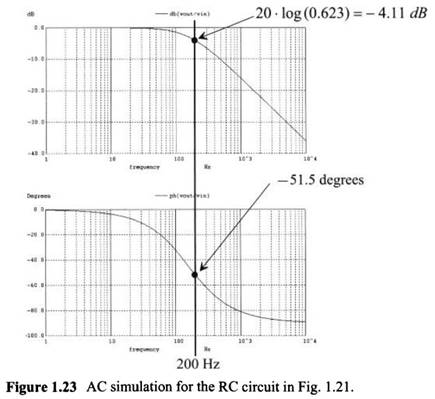
Circuit 4: Fig 1.23 (Page
20)
Respective
Circuit:
LTSpice:
R1 = 995Ω, C1 = 1.005uF
Theoretical Hand
Calculations:
Voltage Divider:
Vout = Vin * [1/(j2πf*C1)] / [R1 + 1/(j2πf*C1)]
Vout/Vin = 1 / ( 1 + j2πf*C1*R1)
//Multiplied Top and bottom by
j2πfC1
|Vout/Vin| = 1 / ![]()
20Log|Vout/Vin| = - 20Log![]()
Phase = tan-1(0/1) - tan-1[(![]() /1)]
/1)]
=-
tan-1[(![]() /1)]
/1)]
f3db = 1/( 2π*C1*R1)
=
1/ (2π*1.005u*995)
f3db = 159.15Hz (Point
where we have 3db and -45˚ Phase shift)
LTSpice Simulation:
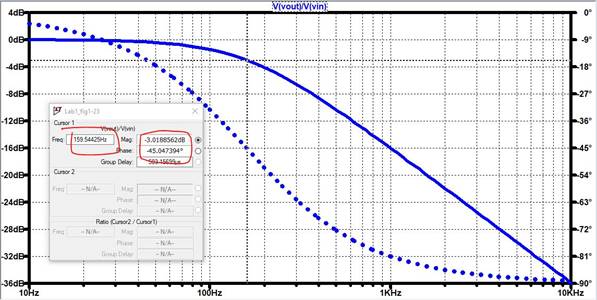
f3db = 159.54Hz
Experimental Part:
For this, we take the Oscilloscope’s calculated Maximum voltages
for both Vin and Vout and take the magnitude, and we read
the oscilloscope’s calculated phase shift.
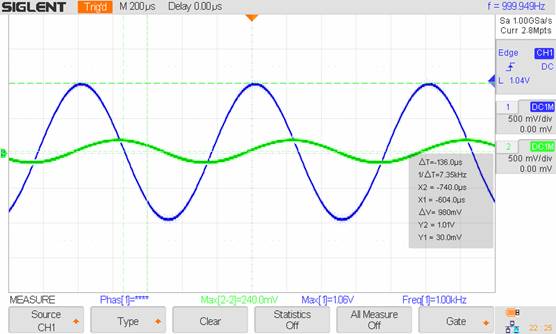
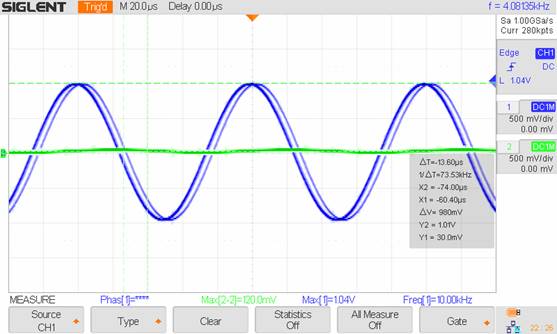
Vin (BLUE), Vout (GREEN)
10Hz: Vout/Vin = 1.08V/1.1V, Mag = -0.16db Phase = -6.61˚
100Hz: Vout/Vin = .92V/1.1V, Mag = -1.55db, Phase = -30.64˚
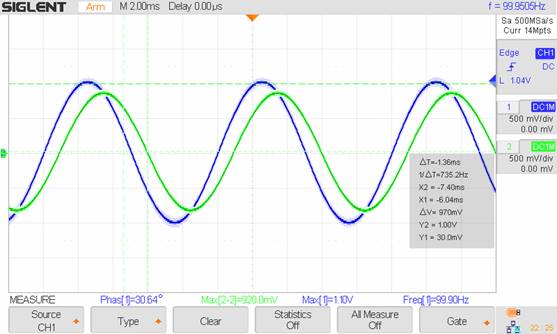
1kHz: Vout/Vin = 0.24V/1.06V, Mag =
-12.9db, Phase ≈ -90˚
10kHz: Vout/Vin = 0.12V/1.04V Mag =
-18.76db, Phase ≈90˚
|
Frequency |
Magnitude |
Phase |
|
10Hz |
-0.16dB |
-6.61 |
|
100Hz |
-1.55dB |
-30.64 |
|
1kHz |
-12.9dB |
≈-90 |
|
10kHz |
-18.76dB |
-90 |
Observations
& Analysis:
From the data, we can assume that both the hand
calculations and the experimental values match. Even though there were some
long shot data from the experiment, the 3dB frequency is in the general area of
150Hz.
Other things that can be taken account for would
be that there is a capacitance in the cable that can cause the 3db frequency to
shift. Also, more data points and specifically one at the 3db frequency would
prove that the hand calculations are correct.
Furthermore, from the data, we can say that this
circuit is for sure a Low Pass filter. For lower frequencies and by
observation, we will generally have an accurate frequency pole, however, and in
future labs, we will have to deal with parasitic capacitances in high frequency
circuits, and these capacitances will cause a problem, however, future testing
and teaching from the labs will help students with figuring out how to deal
with these problems.