
Lab 2 - ECE 421L
Figure 1 - ADC/DAC Schematic

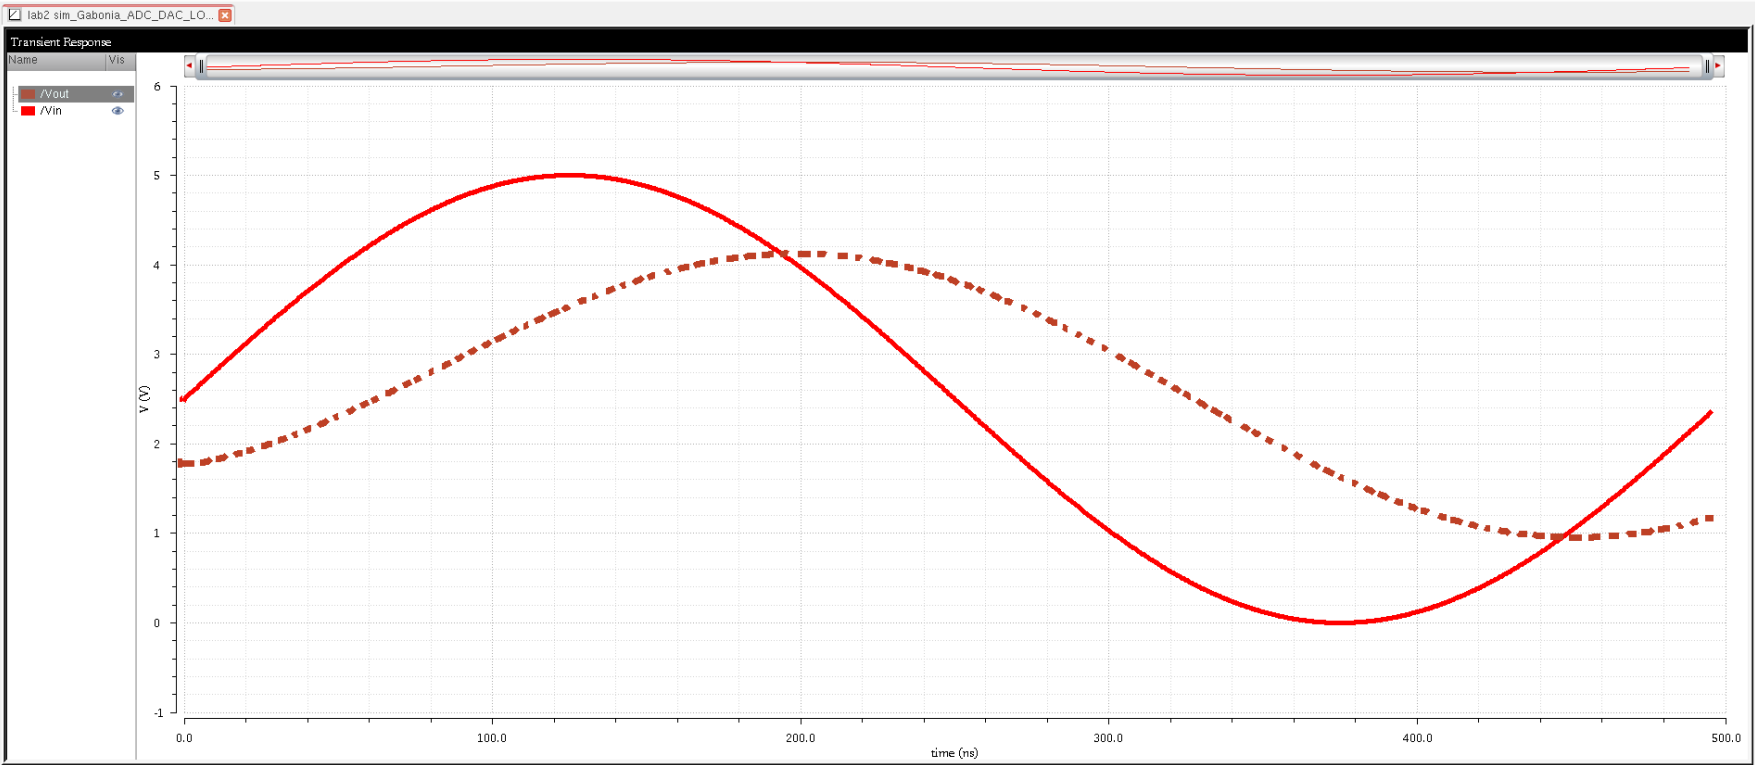
Figure 2 - ADC/DAC Transient Graph
The ADC (Analog to Digital Converter) takes the input signal, Vin, and converts the signal to B[9:0] which is a 10 bit binary value. The 10 bit binary signal then goes into a DAC (Digital to Analog Converter) which converts the signal back into an analog signal, Vout. Vout looks like a staircase because the number of bits determines the voltage step increments.
LSB (Least Significant Bit) is determined through an equation LSB = VDD/2^N with N being the number of bits.
Thus the LSB can be calculated as 4.883mV. The LSB also represents the voltage increment. We can change the number of steps by changing the input voltage. Decreasing the input voltage by a certain amount should decrease the amount of steps. Since one bit takes approximately 5 mV, by changing the input amplitude we can show that the output should only go up one step.


__________________________________________________________________________________
Lab:
Part 1: Creating the DAC and then Testing
The first part of the lab involves creating a DAC with the use of resistors following the schematic shown in fig 30.14

Following the schematic given to us in fig 30.14, I created a resistor chain and then created a symbol for the chain. After the symbol for the R chain was created I connected the resistors in such a way mimicking the fig given to us.


Now that the DAC has been created I needed to create a new symbol and by doing this we just copy the Ideal symbol into the cellview where my created DAC with the resistors is located that way we'll have the same dimensions when reusing the Ideal DAC ADC schematic.

After creating the schematic I replaced the DAC given to us on the Ideal_DAC_ADC schematic and then simulated the results.


Part 2: Output Resistance Calculation
The second part of the lab is to calculate the output resistance of the schematic. To do this we just have to combine all the resistors in parallel and in series. Working from the bottom of the DAC calculating the resistors in parallel and in series the final calculation should be 10K for the output resistance.
Part 3: Delay, Driving a Load
For the 3rd part of the lab we will be grounding all the pins except B9 which will be connected to a pulse source driving a 10pF load. First I will do the calculation using the 0.7RC equation.
td = 0.7(10K)(10pF) = 70ns
After doing the calculation, I will compare it to the simulated results from cadence.


The resutls from cadence show that at the 70ns mark we can see that the output is at 50% of its max.
Part 4: Inserting Loads
For the fourth part of the lab we will be driving different loads using the DAC schematic that was made. The first load will be a 10K resistor.


Looking at the waveform in the graph we can see that the output looks like it's been halved compared to the simulated result without a load. The 10K resistor acts in parallel with the output resistance due to a voltage divider. With an output resistance of 10K we can calculate that the total resistance would be 5K thus halving the output value.
The second load will be a 10pF capacitor.

The 10pF load causes a shift in the output waveform as well as removes the stairway effect and smoothens it out.
The final load will be incorporating both a 10K Resistor and 10pF Capacitor.


The result shows a combination of both of the effects of the previous loads. The output is both halved, shifted and smoothed out.
Part 5: Discussing the Implementation of Mosfets
If mosfets were used in the real circuit design as switches as shown in fig 30.14 and have a resistance that isnt small compared to R, we would see an increase in the 2R part of the circuit. There would be the Rm (Resistance of the Mosfet) + 2R. This slight increase would change up the voltage divider in the overall circuit thus increasing the overall output resistance.