EE 420L – Engineering Electronics II Lab – Lab 8
Due: April 10,
2019
·
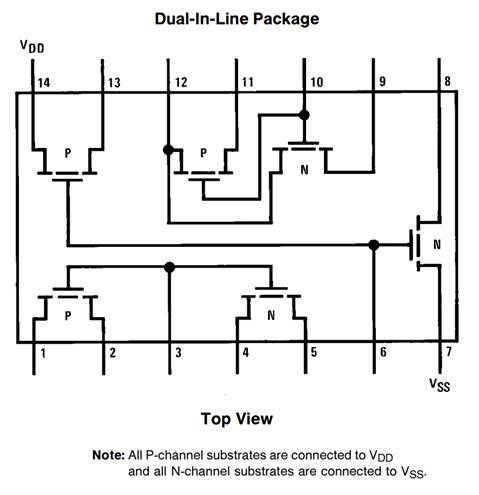
Characterizing MOSFET devices on the CD4007 Transistor Array chip.
- Review the datasheet
for the CD4007.pdf CMOS transistor array.
- Ensure that you
understand how the bodies of the NMOS are tied to pin 7 (VSS, generally
the lowest potential in the circuit, say ground) and that the bodies of
the PMOS are tied to pin 14 (VDD, generally the highest potential in the
circuit, say + 5V).
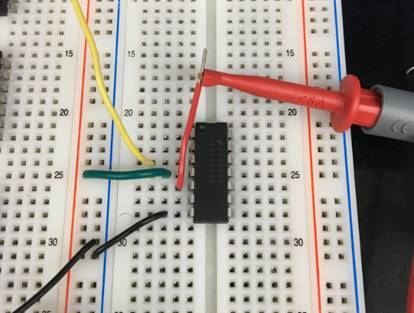
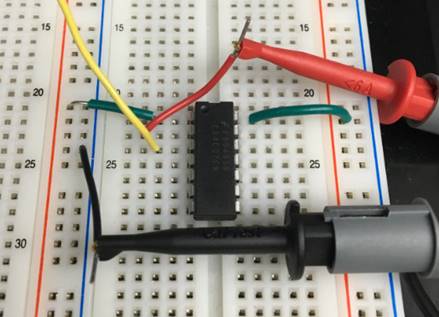
CD4007 Chip
Lab Tasks
In this lab you will characterize the
transistors in the CD4007 (not
the CD4007UB chip)
and generate SPICE Level=1 models. Assume that the MOSFETs will be used in the
design of circuits powered by a single +5 V power supply. In other words, don't
characterize the devices at higher than +5 V voltages or lower than ground
potential.
- Experimentally
generate, for the NMOS device, plots of:
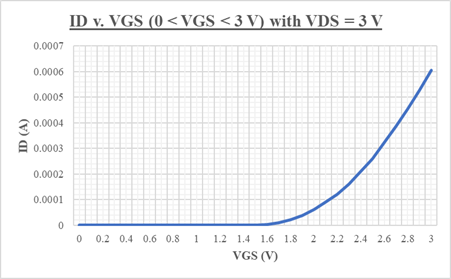
1. ID v. VGS (0
< VGS < 3 V) with VDS = 3 V
2. ID v. VDS (0
< VDS < 5 V) for VGS varying from 1 to 5 V in 1 V steps, and
3. ID v. VGS (0
< VGS < 5 V) with VDS = 5 V for VSB varying from 0 to 3 V in 1 V
steps.
- Note that for this
last one, if VSS (NMOS body) is ground (again, the Body, VB, is
grounded) then the source voltage will be varied from 0 to 3 V in 1 V
steps to realize VSB ( = VS - VB = VS) varying from 0 to 3 V in 1 V steps.
At the same time VGS will be varied from 0 to 3 V (when VS = 0), 1 to 4 V
(when VS = 1 V), 2 to 5 V (when VS = 2 V), and 3 to 5 V (when VS = 3
V). In other words, as VS is increased by 1 V the VGS has
to shift up by 1 V as well.
- Assuming that the
length of the NMOS is 5 um and its width is 500 um calculate
the oxide thickness if Cox (= C'ox*W*L) = 5 pF.
- From this measured
data create a Level = 1 MOSFET model with (only) parameters: VTO, GAMMA,
KP, LAMBDA, and TOX.
- Compare the
experimentally measured data above (the 3 plots) to LTspice-generated
data (again, 3 plots) and adjust your model accordingly to get better
matching.
- Experimentally,
similar to what is seen on the datasheet (AC test circuits seen on page 3
of the datasheet), measure the delay of an inverter using these devices
(remember the loading of the scope probe is around 15 pF and there is
other stray capacitance, say another 10 pF).
- Using your model
simulate the delay of the inverter and compare to measured results. Adjust
your SPICE model to get better matching between the experimental data and
the measured data.
- Repeat the above
steps for the PMOS device where VDS, VGS, and VSB are replaced with VSD,
VSG, and VBS respectively.
----------------------------------------------------------------------------
NMOS Device Characteristics
The data that was collected in
characterizing the devices can be found here.
Calculations
Values for calculations
were chosen from the data, linked above. ID,sat was chosen for VGS = 3V.
The drain current at the point of saturation for
VGS = 3V was estimated to be:
ID,Sat = 565 ![]() A
A
Picking two points on the curve one the device
is in saturation, slope can be found:
Slope = ![]()
The channel length modulation parameter (Lambda)
can be calculated by:
Lambda = ![]()
Cox, the oxide capacitance, is given by:
![]()
To calculate oxide capacitance per area, given W
= 500 µm and L = 50 µm:
![]()
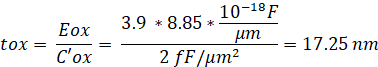
The oxide thickness can be calculated by:
![]()
Eox can be calculated by the following where Er is the relative dielectric constant of
silicon dioxide
and E0 is the vacuum dielectric
constant:
![]()
After calculating the previous two parameters,
the oxide thickness can be calculated by:
By inspection, the threshold voltage was found
to be roughly
Vthn = 1.75V
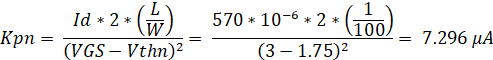
The transconductance parameter can be found by:
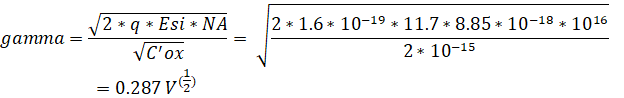
Finally, Gamma, the body-effect parameter, can
be found by:
The table below
summarizes the hand calculations above.
|
Vthn |
1.75V |
|
Gamma |
0.287 V(1/2) |
|
Kpn |
7.296 |
|
Lambda |
0.0257/V |
|
Id |
565 |
|
tox |
17.25nm |
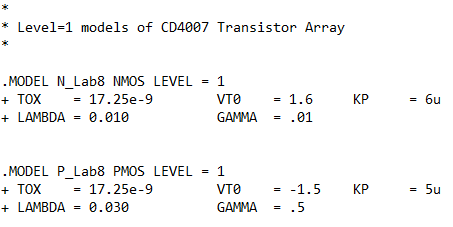
The values calculated by hand were used to create level 1 MOSFET
models.
Testing the models with hand calculated values led to poor
matching. The values seen
below are the values that were selected to achieve the best
matching between experimental
and simulation results.
Using the models created, simulation results match experimental results
quite well. The following
images demonstrate the matching of the NMOS device simulations to
the gathered experimental results.
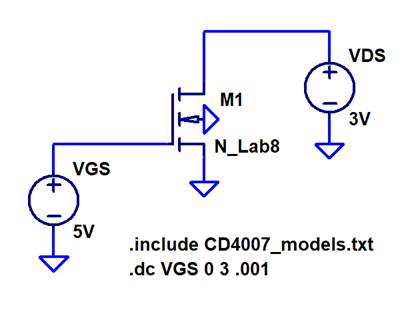
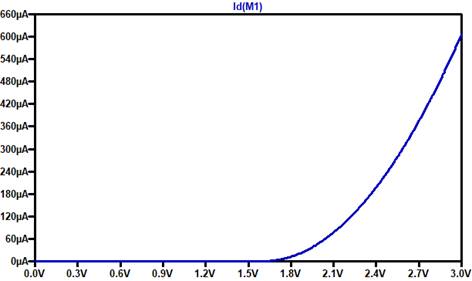
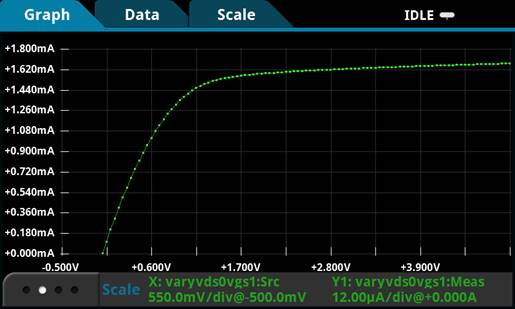
1.
ID v. VGS (0
< VGS < 3 V) with VDS = 3 V
o Simulating ID v. VGS with fixed
VDS allows us to approximate the NMOS threshold voltage by inspection.
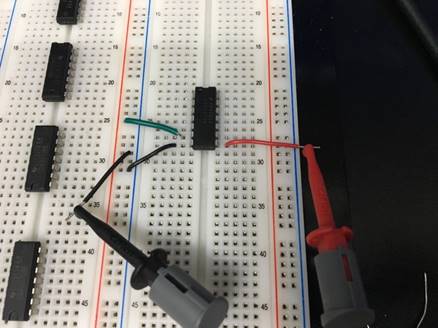
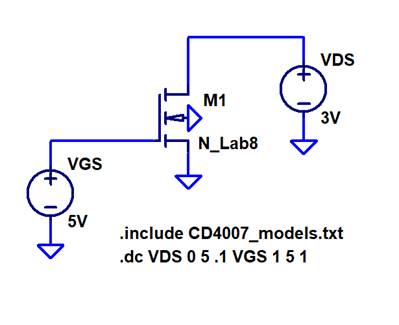
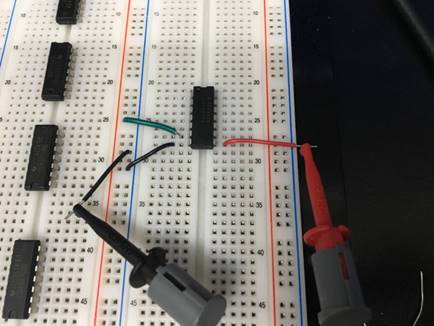
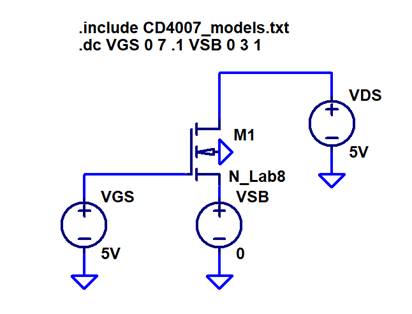
Schematic and Breadboard Implementation
Simulation Results in LTspice, Experimental
Results in Excel
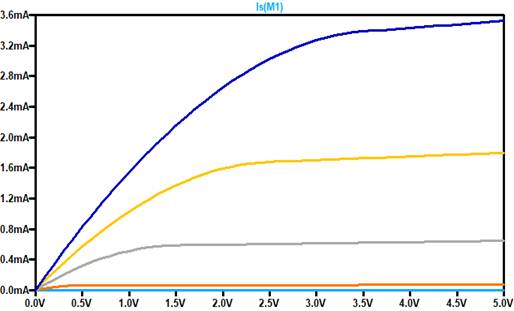
2.
ID v. VDS (0
< VDS < 5 V) for VGS varying from 1 to 5 V in 1 V steps
o Simulating ID v. VDS with fixed
VGS values allows us to approximate the saturation current and saturation
drain-to-source voltage of the NMOS.
Schematic and Breadboard Implementation
Simulation Results in LTspice,
Experimental Results in Excel
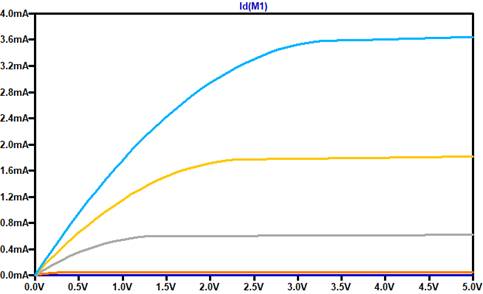
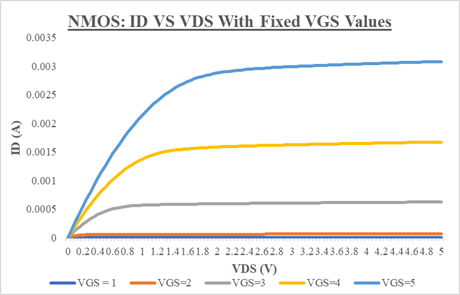
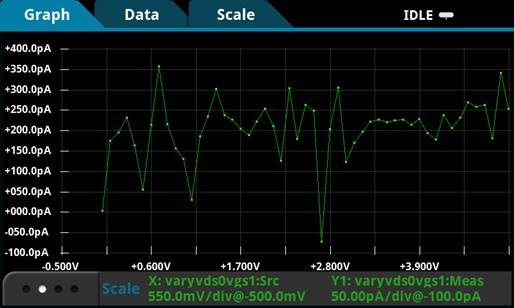
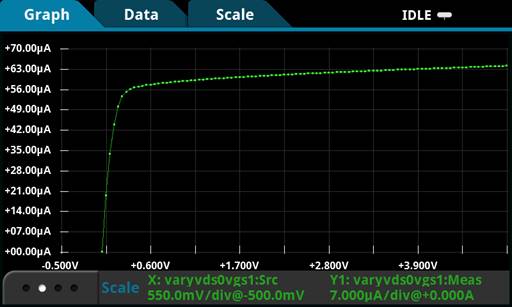
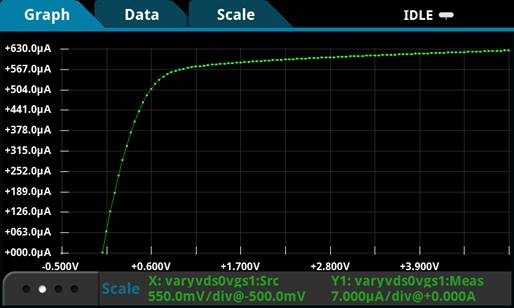
Using the Kiethley 2450 Source Meter to measure IV Curves:
VGS = 1
VGS = 2
VGS = 3
VGS = 4
VGS = 5
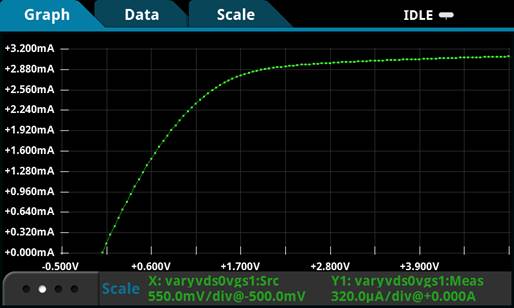
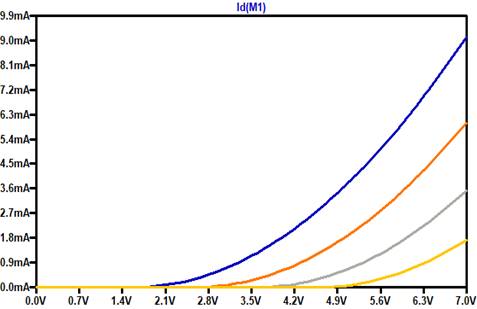
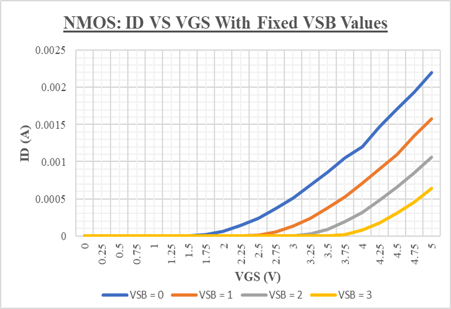
3.
ID v. VGS (0 < VGS < 5 V)
with VDS = 5 V for VSB varying from 0 to 3 V in 1 V steps.
o Simulating ID v. VGS with fixed
VDS for varying VSB values allows us to approximate the NMOS body effect.
Schematic and Breadboard Implementation
Simulation Results in LTspice,
Experimental Results in Excel
----------------------------------------------------------------------------
PMOS Device Characteristics
The data that was collected in
characterizing the devices can be found here.
Calculations
Values for calculations
were chosen from the data, linked above. ID,sat was chosen for VSG = 5V.
The drain current at the point of saturation for
VGS = 3V was estimated to be:
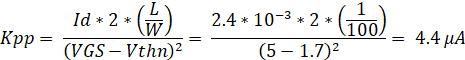
ID,Sat = 2.4 mA
Picking two points on the curve one the device
is in saturation, slope can be found:
Slope = ![]()
The channel length modulation parameter (Lambda)
can be calculated by:
Lambda = ![]()
Cox, the oxide capacitance, is given by:
![]()
To calculate oxide capacitance per area, given W
= 500 µm and L = 50 µm:
![]()
The oxide thickness can be calculated by:
![]()
Eox can be calculated by the following where Er is the relative dielectric constant of
silicon dioxide
and E0 is the vacuum dielectric
constant:
![]()
After calculating the previous two parameters,
the oxide thickness can be calculated by:
By inspection, the threshold voltage was found
to be roughly
Vthp = 1.70 V
The transconductance parameter can be found by:
Finally, Gamma, the body-effect parameter, can
be found by:
The table below
summarizes the hand calculations above.
|
Vthp |
1.7
V |
|
Gamma |
0.287 V(1/2) |
|
Kpp |
4.4 |
|
Lambda |
0.0317/V |
|
Id |
2.4 mA |
|
tox |
17.25 nm |
The values calculated by hand were used to create level 1 MOSFET
models.
Testing the models with hand calculated values led to poor
matching. The values seen
below are the values that were selected to achieve the best
matching between experimental
and simulation results.
Using the models created, simulation results match experimental
results quite well. The following
images demonstrate the matching of the PMOS device simulations to
the gathered experimental results.
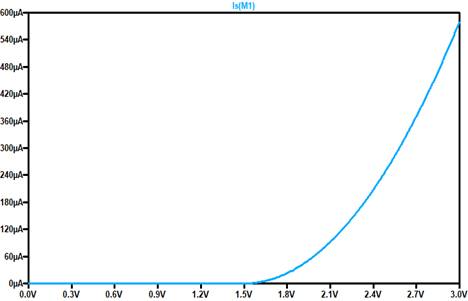
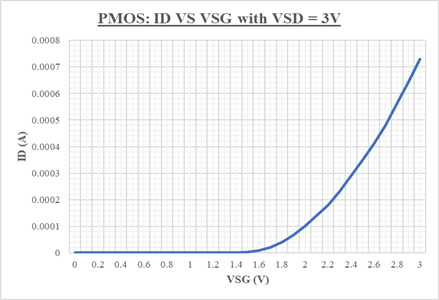
1.
ID v. VSG (0
< VSG < 3 V) with VSD = 3 V
o Simulating ID v. VSG with fixed
VSD allows us to approximate the PMOS threshold voltage by inspection.
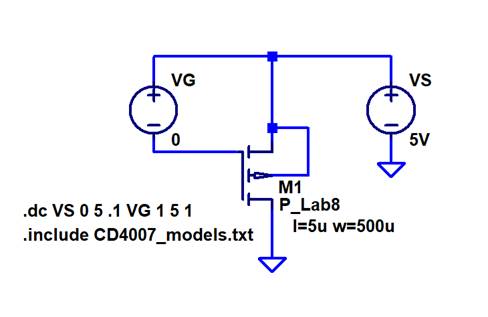
Schematic and Breadboard Implementation
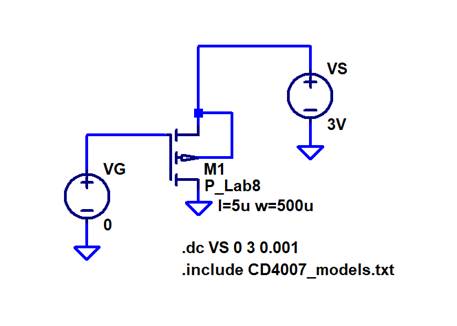
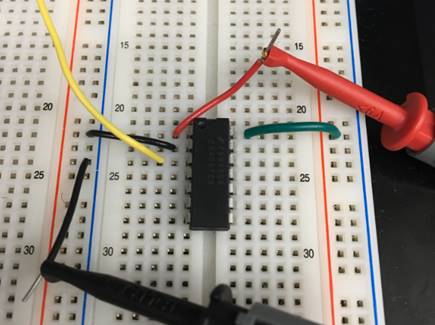
Simulation Results in LTspice,
Experimental Results in Excel
2.
ID v. VSD (0
< VSD < 5 V) for VSG varying from 1 to 5 V in 1 V steps
o Simulating ID v. VSD with fixed
VSG values allows us to approximate the saturation current and saturation
source-to-drain voltage of the PMOS.
Schematic and Breadboard Implementation
Simulation Results in LTspice,
Experimental Results in Excel
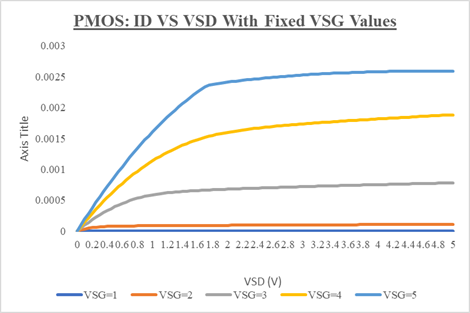
Using the Kiethley 2450 Source Meter to measure IV Curves:
VSG = 1
VSG = 2
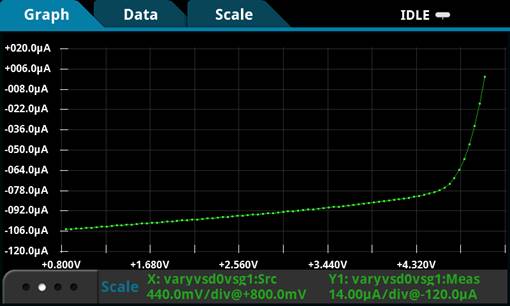
VSG = 3
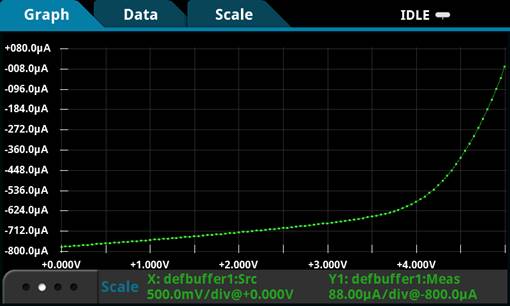
VSG = 4
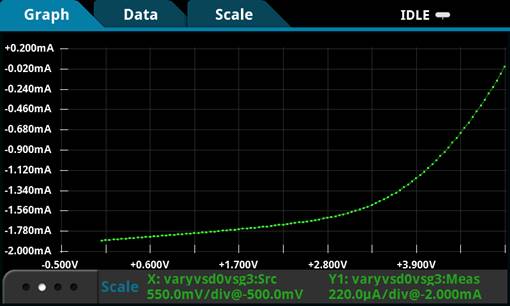
VSG = 5
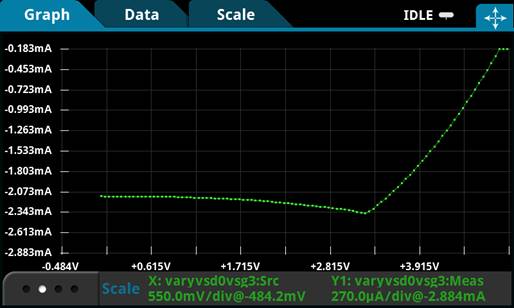
3.
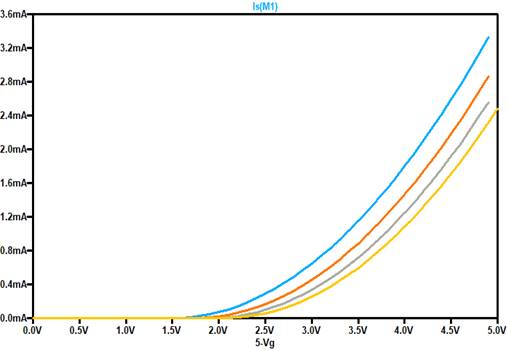
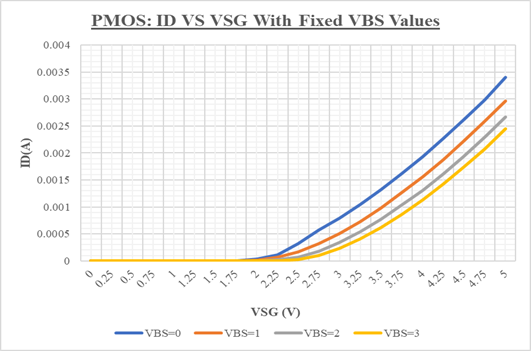
ID v. VSG (0 < VSG < 5 V)
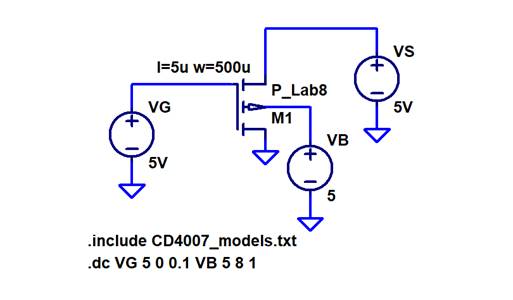
with VSD = 5 V for VBS varying from 0 to 3 V in 1 V steps.
o Simulating ID v. VSG with fixed
VSD for varying VBS values allows us to approximate the PMOS body effect.
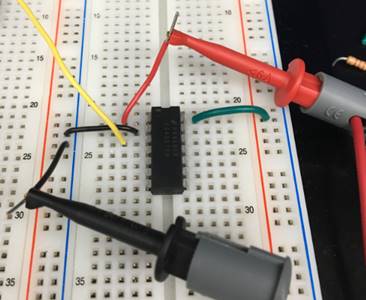
Schematic and Breadboard Implementation
Simulation Results in LTspice,
Experimental Results in Excel
----------------------------------------------------------------------------
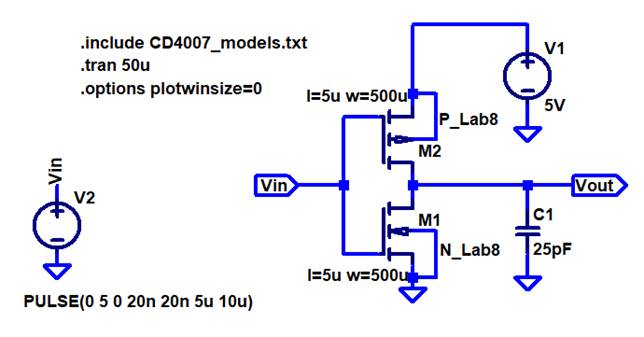
Inverter Using CD4007 Models
To test the models that were created for these transistors, we
will compare the delay of the on-chip inverter experimentally
with the delay of an inverter created using the CD4007 MOSFET
models. The 30 pF load capacitor is added to simulate
the
cable capacitance and scope probe capacitance.
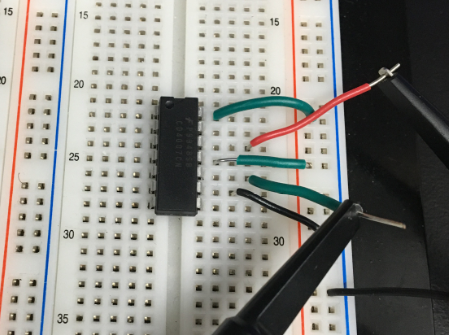
Schematic and Breadboard Implementation
Simulation and Experimental Inverter Waveforms
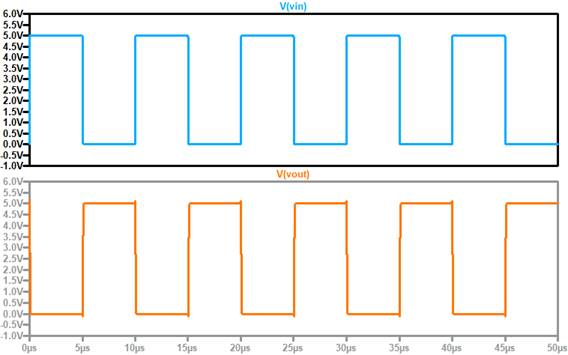
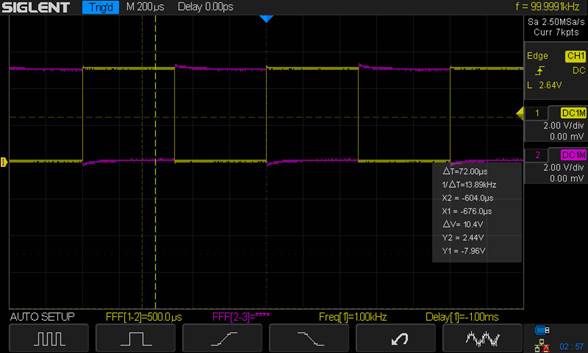
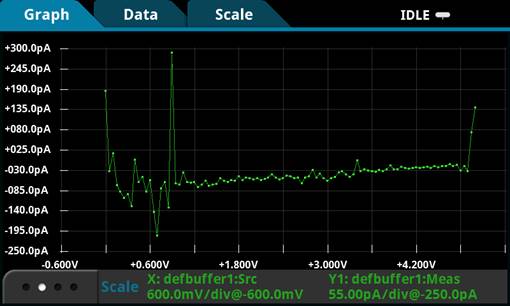
Simulation of Inverter Delay and Oscilloscope Function to
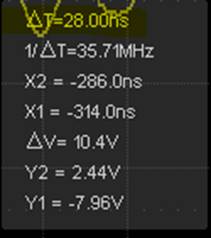
Calculate Inverter Delay Experimentally
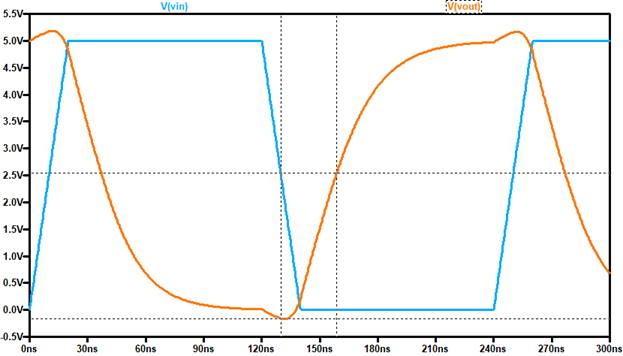
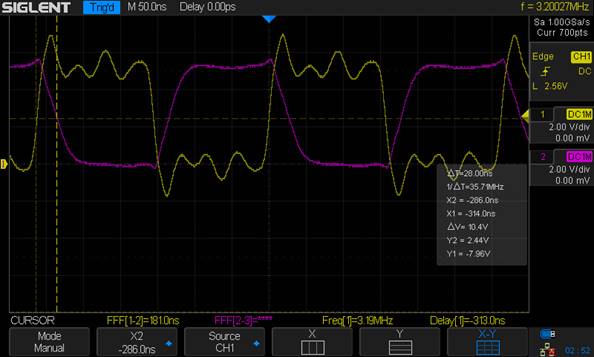
The delay through an inverter can be measured by subtracting the
time at which the input signal reaches 50% of its maximum value by the
time at which the output signal reaches 50% of its maximum value.
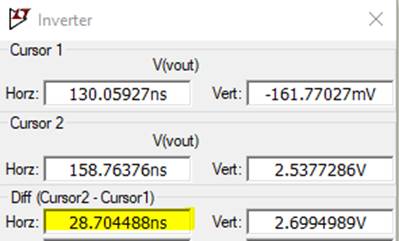
The cursors in
LTspice give a delay of 28.7 ns from the input to the
output, while the experimental delay is 28.0 ns.
Off by less
than 1 nanosecond, we conclude that the spice models generated are remarkably
accurate level 1 models.