Design of a CMOS Voltage Amplifier
Due: May 8,
2019
Project Specifications:
·
Amplifier must
have a gain of 10.
·
ZVN3306A NMOS and ZVP3306A PMOS
devices are to be used in the design.
·
Design should be as fast as
possible driving a 1k resistive load.
·
Input resistance of amplifier
must be no less than 50k.
·
Amplifier should be designed
with as large of an output swing as possible.
·
Design must be capable of
passing a 100 Hz input signal.
·
Design can draw no more, under
quiescent conditions, than 1mA from a +9V power supply.
Summary
To briefly summarize, the objective of this
project is to design, build, and test a voltage amplifier
with a gain of 10 that draws minimal current
from the power supply with no input signal, and is
capable of driving a 1k resistive load. The
most efficient amplifier topology to achieve this goal is the
push-pull amplifier, which is capable of
sourcing and sinking the necessary current to drive the load,
capable of achieving high gain, all while
drawing a small amount of current from the power supply.
Below is a table summarizing each stage of the
amplifier, and the cascaded final amplifier.
Amplifier Stage Characteristics
|
Stage |
Input Resistance |
Output Resistance |
Gain Calculated Simulated Experimental |
||
|
1 |
50kΩ |
100.6Ω |
0.98 |
0.978 |
0.92 |
|
2 |
50kΩ |
1kΩ |
-9 |
10.48 |
3.5 |
|
Total (1 & 2) |
50kΩ |
1kΩ |
-8.81 |
10.0 |
3.1 |
Comparison of Experimental to Simulation
Results
|
Parameter |
Gain |
Current Drawn |
High 3dB Freq. |
Low 3dB Freq. |
Output Swing |
|
Theoretical |
-10 |
775µA |
3.8 MHz |
6 dB |
4.3 V |
|
Experimental |
-10 ** |
511µA |
350 kHz |
3 dB |
5.2 V |
** indicates that the resistor values were
modified to achieve a gain of 10, further discussed below.
Note that the experimental gain is much lower
than the simulated gain and the hand-calculated gain.
This is likely due to poor modeling of the 3306
MOSFETs in LTspice. After changing the values of R3
and R2 in the schematic seen below from 5k to
1k, the experimental gain became 10. From the hand
calculations in this report, we see that the
gain of the push-pull stage increases when the values of R2
and R3 decrease. By decreasing the value
experimentally by a factor of 5, the gain went up by a factor
of roughly 3. The schematic of the final
amplifier design is seen below.
Final Schematic:

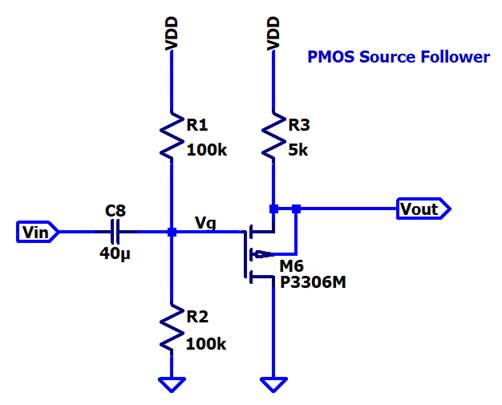
The final design consists of a PMOS Source
Follower (input voltage buffer and current
amplifier) cascaded with a push-pull amplifier.
The push-pull stage ideally has a gain of -10,
while the input stage ideally has a gain of 1,
resulting in a total gain of -10. Below is a table
containing the spice error log for a DC
operating point simulation in LTspice of the final
schematic.
The transconductance values (gmn and gmp) found in the table
will be used in the hand calculations
that follow.
Experimental Transistor Characteristics

Breadboard Implementation

The two resistors off to the side on the bottom right are the 5k
resistors that were replaced
by 1k resistors to enhance the gain. All other values (capacitors
and resistors) are true to their
values in the schematic.
--------------------------------------------------------------
Calculations:
Stage One: PMOS Source Follower
Frequency Response:

As was recorded in the summary table, the simulated gain of the
first stage
is roughly 0.98 V/V.
Input Resistance:
Looking into the input of the amplifier,
![]()

Since this is the first stage of the two-stage amplifier,
Rin = 50k is the input resistance for the first stage, as well
as for the entire cascaded amplifier.
Output Resistance:

Looking into the source of the PMOS device,


Gain:
![]()
![]()
![]()
Substituting for id
yields:
![]()
Substituting for vsg yields:
![]()
![]()


![]()
From spice error log,

Therefore, theoretical gain of Stage One is given by:

--------------------------------------------------------------
Stage Two: Push-Pull Output Stage

Frequency Response:

In spice, the gain of the second stage needed to be designed to be
higher than
10 so that when the two stages are cascaded, their gain product is
equal to ten.
Input Resistance:

Assuming the push-pull stage has gain A:
![]()
By Ohm’s Law, the current through Rbig
is:

Input resistance of the push-pull is then given by:

Output Resistance:
![]()
Gain:

By Kirchoff’s Current Law (KCL):
![]()
Treating capacitors as AC shorts,
![]()


By symmetry, the equation for id2 can be found:

Since we know that:
![]()
We can write an equation for Vout:
![]()
Where


Substituting iout into the equation for vout yields:

Therefore, the gain of the push pull stage is given by

Finally, the theoretical gain of Stage Two is given by:


Neglecting the capacitive impedances has likely led to the
shortage
of gain in our hand calculations. Since the parallel impedance of
R1 and R2
is in the denominator and scaled by the load resistance, a more
accurate
gain calculation would include the impedance of the 220uF
capacitors.
LTspice does not neglect those capacitors, which is why the simulations
using
these values yields a gain of -10.
Plugging the gain back into the formula for Rin, Rin can be found
by

Meeting
Specifications:
AC Analysis
(Gain Requirement)
The design specification for frequency response states that the
gain of the
amplifier must be 10, and the amplifier must be able to pass a 100
Hz signal.

The frequency response of the amplifier plotted in LTspice can be observed above.
The amplifier has a high 3dB frequency of around 3 MHz
theoretically, and a low
3dB frequency of around 6 Hz theoretically. Experimental results
can be found below.

Testing the limits of the amplifier experimentally, we see above
that the low 3dB
frequency (gain of 7.07) is lower than that of the simulation,
around 3 Hz. The period is
shown on the oscilloscope as 2*167ms or 333ms. This means the
frequency of the signal
is roughly 3 Hz.
Below, we see the high 3dB frequency of the amplifier is 350 kHz.
This is much lower than
the simulated 3dB frequency. The ideal parameters in LTspice likely add to the 3dB frequency,
which is why experimental results yield a much lower value.

--------------------------------------------------------------
Transient
Analysis (f = 10kHz)
For simple transient analysis to analyze and confirm the operation
of the amplifier, a 100mV sine
wave was input to the amplifier to verify a gain of 10 at f =
10kHz.
100mV Input Signal, 1V Output Signal

Cursors were used to confirm that the experimental input signal
matches
the input signal in LTspice.

The output signal has a peak-to-peak voltage of 2.16V (see below),
while the
input signal has a peak-to-peak voltage of 200mV. The gain of ten
is verified,
and the signal is out of phase by 180 degrees, meaning it is
inverted. This
confirms our hand calculations for negative gain.

--------------------------------------------------------------
Output Swing
The output swing of the amplifier is important because it limits
the signals that we can amplify before
clipping or “railing” occurs. A large input signal was fed into
the amplifier so that it would rail, and the
output swing could be measured.
1V Input Signal, Measuring Experimental Output Swing

In the simulation above, we see that the output rails high at
2.63V, and rails
low at -1.71V. Taking the difference between the two voltages, the
output swing of
the amplifier is 4.343V (theoretically)
Below, the experimental results are shown for the same input
signal fed into the
Breadboard implementation of the amplifier. However, the output
swing of the real
amplifier is larger than that of the simulation, with an output
swing of 5.2V. The big
difference is that the experimental amplifier rails low 600mV
lower than the
simulated amplifier.

--------------------------------------------------------------
Current Drawn under
Quiescent Conditions (no input signal)
The current requirement was not an easy requirement to meet at
first. In the first revision of the design,
two common source amplifiers (one NMOS and one PMOS) were cascaded
to achieve a gain of 10, but the
current drawn from the power supply was nearly 7 mA, far above the
specification. After adjusting values and
making lots of changes, the gain was 10, the current drawn was
just over 800 µA, but the output swing was less
than 1V. It was concluded that a push-pull stage was absolutely necessary to meet all of the project
specifications.
Below, we see the complete amplifier with no input signal (Vin is
at ground). The current measured through V1, a
0 volt voltage source in series with the power supply, is 775 µA. This
means that theoretically, the circuit meets
the current requirement.


Experimentally, a Kiethley 2450 SourceMeter, capable of sourcing voltage while measuring
current, was used to
measure the current drawn from the power supply as it source 9V,
and no input signal is connected. As we see from
the image below, the source meter measures 511 µA drawn as 9V is
sourced. This means that experimentally, the
circuit meets the specification for current limitations as well.


--------------------------------------------------------------
Passing a 100
Hz Signal
A 10mV sine wave was fed into the amplifier to verify a gain of 10
at 100 Hz.
Below, we see that theoretically, the design meets the
specification.

A 100mV peak-to-peak sine wave was fed into the amplifier on the
breadboard, since 10mV
signals are far noisier. We see that the output voltage has a
delta of over 1, which means that
experimentally, the amplifier can pass a 100 Hz signal with a gain
of 10 as well.

--------------------------------------------------------------
Speed of
Design Driving a 1k Load (10kHz Square Wave Input)
Square Wave Output with Gain of 10


The timing measurements between the experimental results and the
theoretical
simulation results do not compare well. Regardless, each
characteristic was measured
experimentally and theoretically, below.
Time Delay Between Input and Output Signal


We see that the time delay between input and output for the
amplifier is
Experimentally 10 times longer than that of the simulation
results.
Rise Time of Output Signal


The experimental rise time is roughly 20 times greater than that
of the
simulation results.
Fall Time of Output Signal


The fall time is experimentally 100 times larger in
experimentation than
in simulation.
To summarize, the amplifier meets all of
the specifications. It is capable of
driving a 1k resistive load, it has a gain of 10, it can pass a
100 Hz signal, it has
a large output swing, and it only draws 0.5 mA of current from a
9V supply.
In the future, the design could be improved to drive larger loads
by adding a wide W
output stage, but this stage would burn up a bunch of power trying
to drive loads.
As slow as the timing characteristics are in the circuit on the
breadboard, however, it may
be worth the power consumption to speed up the circuit.