Lab 7 - ECE 420L Engineering Electronics II Lab
Authored
by Frank Sanchez,
sanchezf@unlv.nevada.edu
3/28/2017
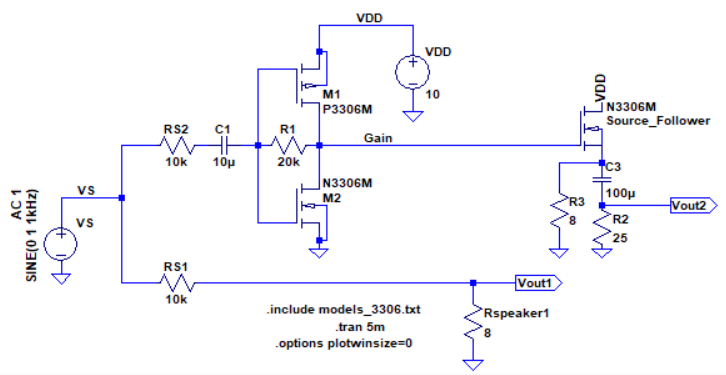
Design an Audio Amplifier (Frequency range from 100Hz to 20kHz)
- Using a one 10uF capacitor and one 100uF capacitor.
- Using a 10v Supply voltage
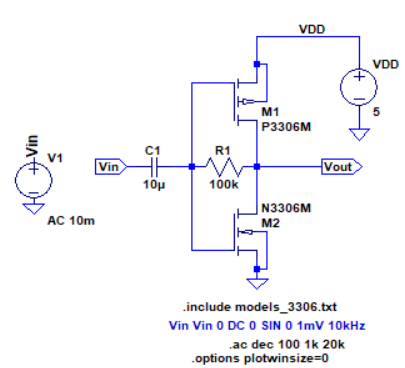
Following the push-pull amplifier topology from lab 6. I should get a big gain for my circuit.
As shown below. By using previously the gmn and gmp from lab 6, you note that the gain is : Av=(10k)(18.24m+10.59m)=288V/V.
++++++++++++++
LT Spice Simulations
++++++++++++++
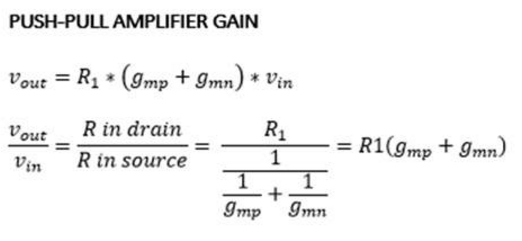
The
picture below shows a speaker directly connected to a big load. The
difference in impedance gives out a small power dissipation.
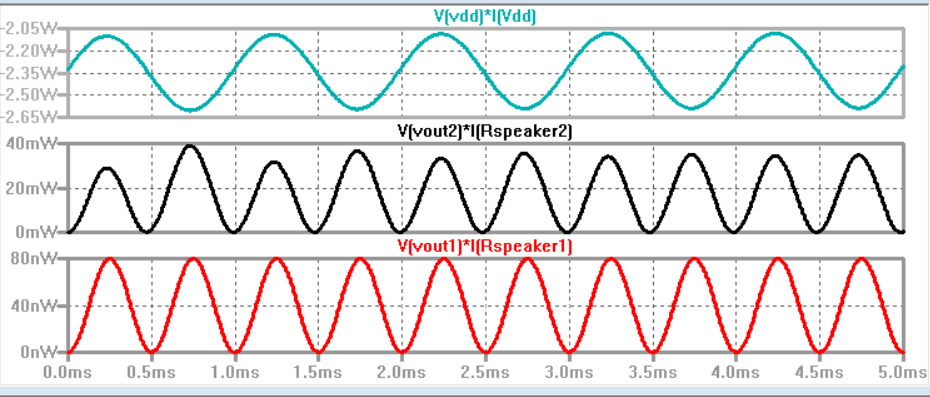
Simulation:
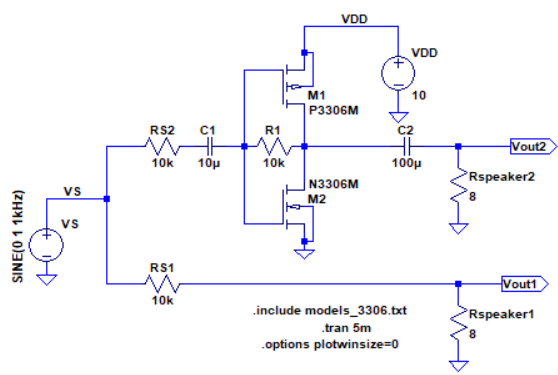
Using a push-pull amplifier for the design is benificial due to its ability to produce high gain.
The output on the picture on the left shows a peak voltage of about 500 mV. This in hand shows how the voltage would be amplified and not avg. around 0 volts. As for the picture on the right, you can see the average
power being around 2.35W. You can also see the differne in power
between the two speakers when applied in different topologies.
Build and test your design
When
i tested the initial circuit, i found out how hot the transistors would
got. Issue being that the output impendance for the design is too high
for the push-pull. That in hand, you know that the high output
impedenace is connected to the small 8-ohm speaker. The goal in hand
was to create a circuit that can support the 8-ohm resistor.
The source follower was used, because of its support of low output impedance, and high output impedance.
++++++++++++++
LT Spice Simulations
++++++++++++++
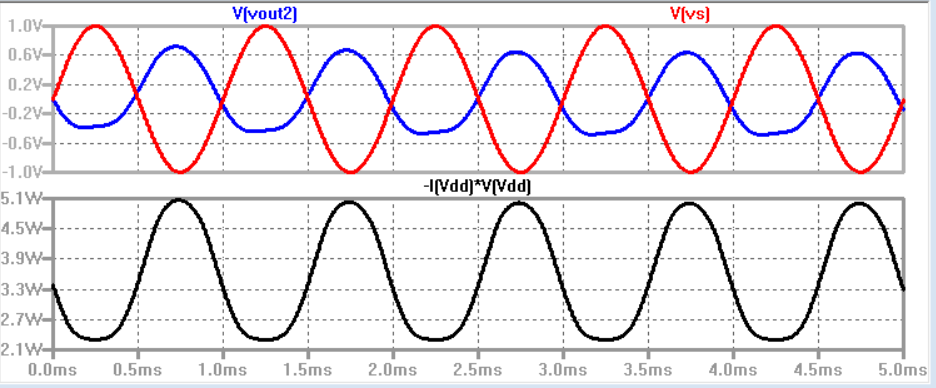
Shown
below are the simulations when including the source follower.
Thankfully, the gain wasn't affected by much; and the power for the
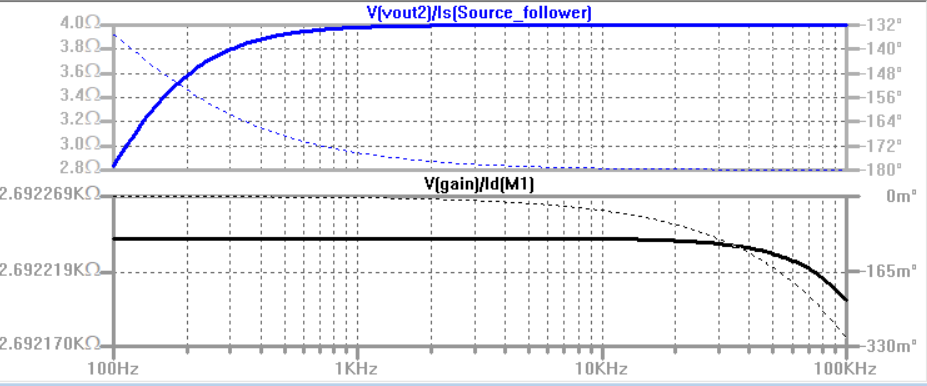
circuit was centered around 3.3W with a 1.8W swing. The image to the
right shows the output impedance for the push pull and the output
impendance after applying the source follower; whihc is shown for
reference. The input impedance for the push pull being 20k.
Expected output voltage was around 900mV.
++++++++++++++
Lab Experiment
++++++++++++++
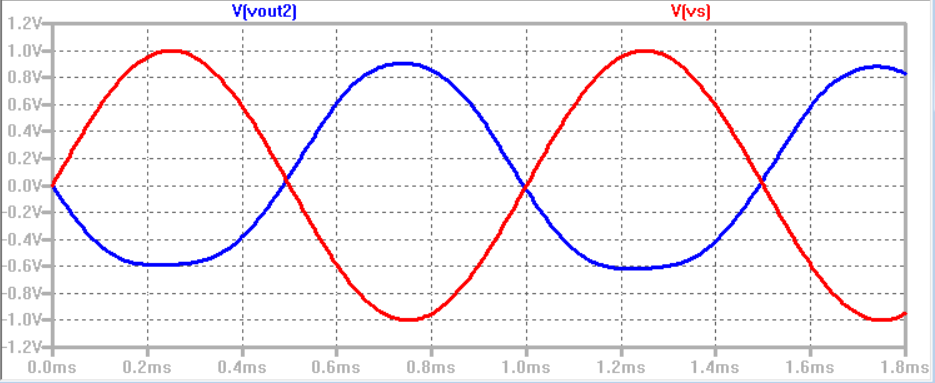
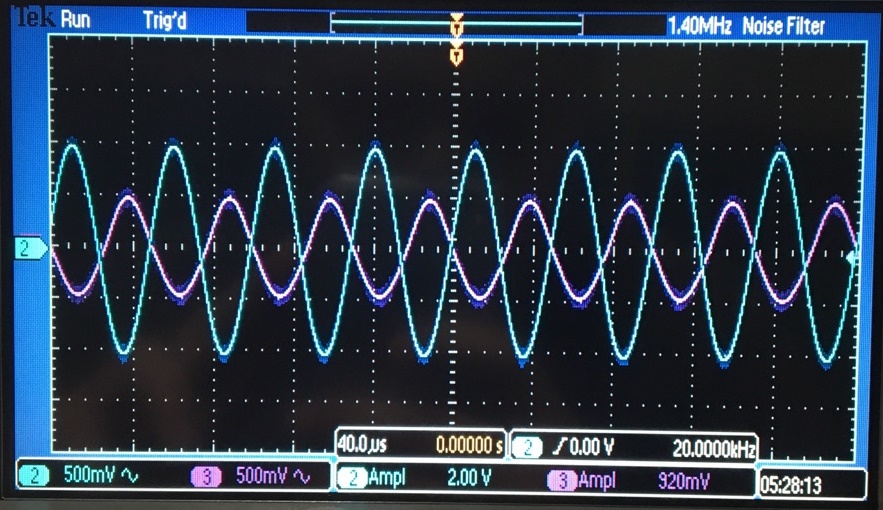
The
output signal from the speaker resulted in a lot of distortion; along
with a lot of heat dissipation. But through the experiment, you can see
that the experiment output signal came around 960mV. The output signal
was close to the theoretical values simulatied.
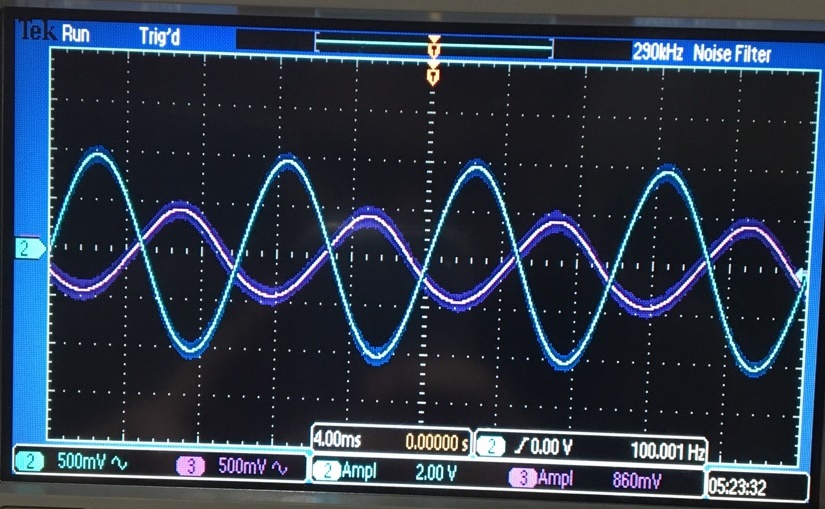
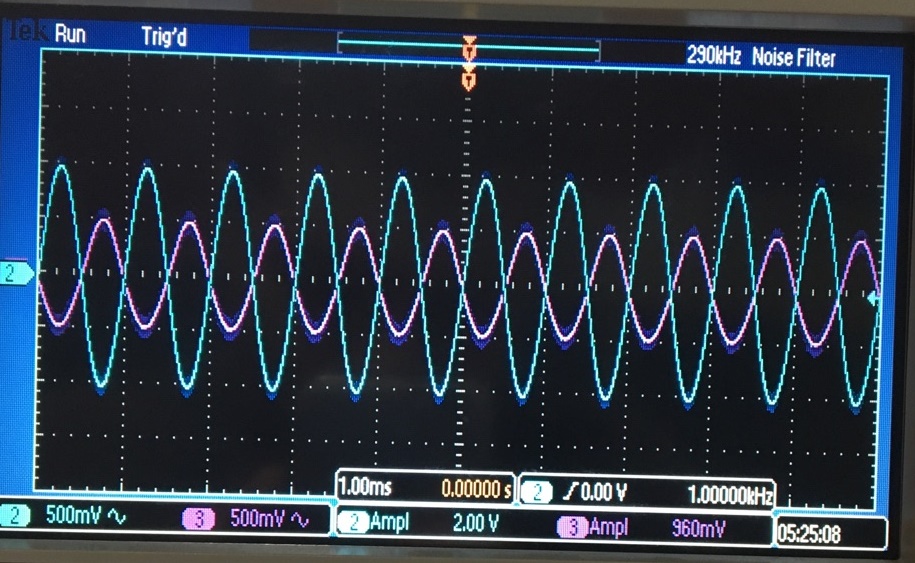
100Hz and 1kHz frequency
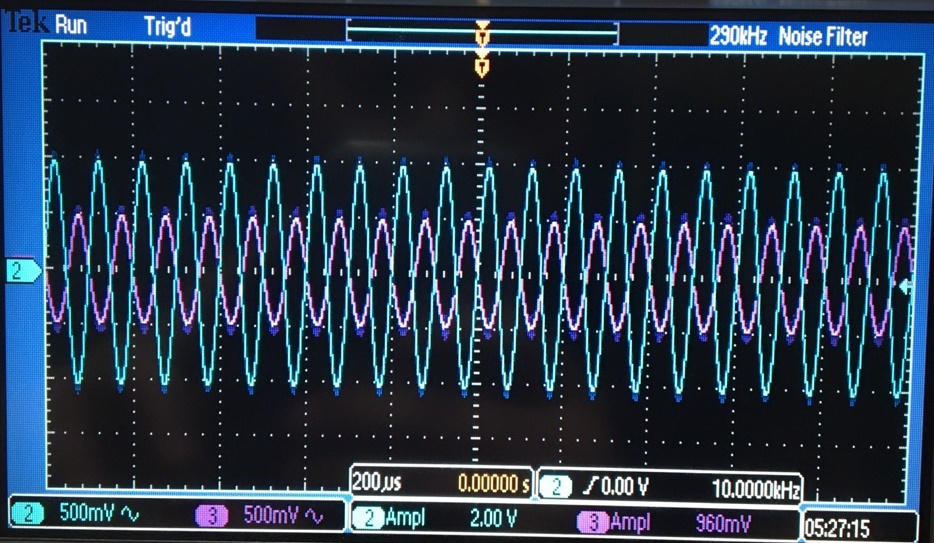
10kHz and 20kHz frequency
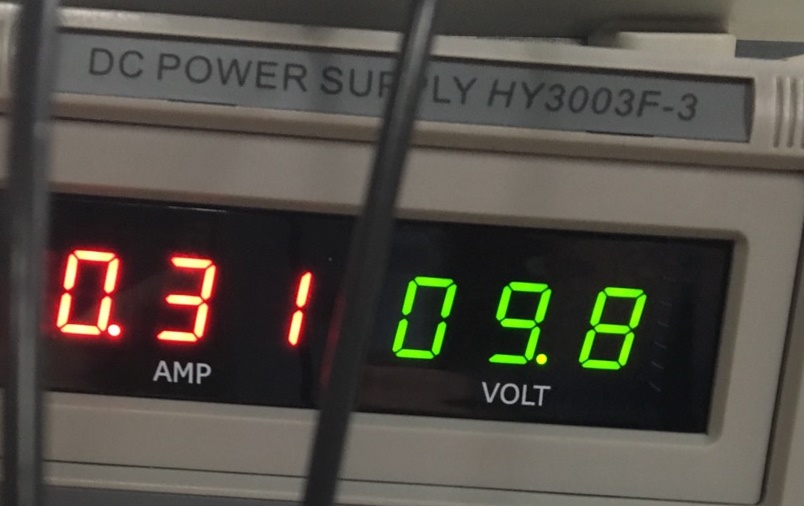
Power Dissipation
Based on the total circuit.
The total current throughout the circuit was referenced using the power
supply. By knowing that P=V*I, I know that the power dissipated would
be 3.03W. The current in hand caused the circuit to heat up pretty quickly.
++++++++++++++++++++++++++++++++++++++++++++++++++++++++++++++++++++++++++++++++
Conclusion:
In
conclusion, i noted that in order to have a good performance
circuit, i must have pretty close impedance values between the
transistor and the speaker being used. Problems like these make the
circuit heat up quicker and giving the student a bad result.
Return to EE 420L Labs