Lab 2 - EE 420L
Authored
by Desi Battle, battled@unlv.nevada.edu
1/26/2016
Coax Compensation 101
Exp 1: Show scope waveforms of a 10:1 probe undercompensated, overcompensated, and compensated correctly.
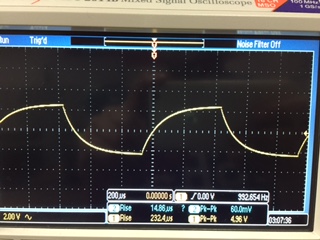
Undercompensated probe
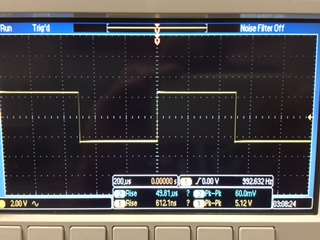
Perfectly compensated probe
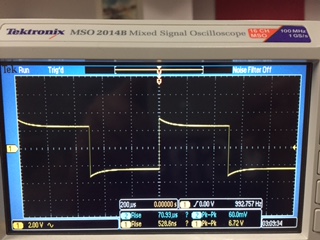
Overly
compensated probe
Undercompensated
-- caused by the impedence at the probe tip being too low compared to
the impedence seen at the scope, creates slow rise times.
Compensated
-- The ideal situation where parallel impedence at probe tip is some
integer multiple of the impedence at the scope.
Overcompensated -- Caused by making probe tip impedence too large and forcing scope output to momentarily overshoot.
***************************************************************************************************************************************************************
EXP 2: Comment
on where the type of scope probe (i.e., 1:1, 10:1, 100:1, etc.) is set
on your scope (some scopes detect the type of probe used automatically).
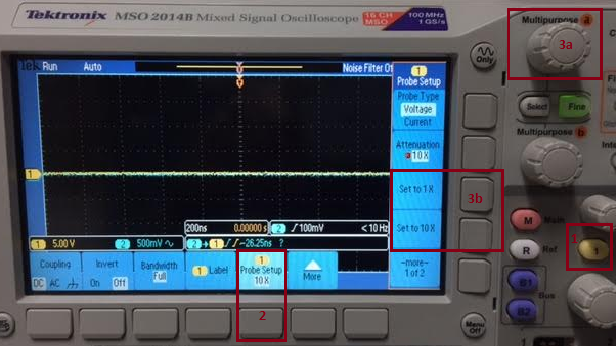
1. Press channel button corresponding to the attenuation you would like to set
2. Press the button for probe setup
3a. scroll the multipurpose wheel CW for more attenuation or CCW for less attenuation
OR
3b. select one of the common settings listed under Probe Setup
***************************************************************************************************************************************************************
Exp 3: Draft the schematic of a 10:1 scope probe showing: the 9 MEG resistor, 1 MEG scope input resistance,
capacitance of the cable, scope input capacitance, and capacitance in the probe tip
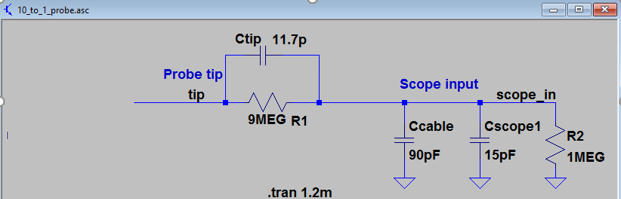
Schematic of 10 to 1 scope probe
***************************************************************************************************************************************************************
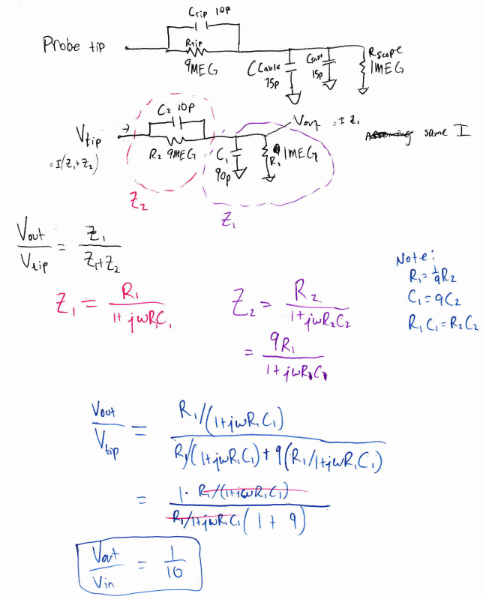
Exp 4: Using circuit analysis, and reasonable/correct values for the capacitances, show using circuit analysis and
alegbra (no approximations), that the voltage on the input of the scope is 0.1 the voltage on the probe tip.
***************************************************************************************************************************************************************
Exp 5: Devise
an experiment, using a scope, pulse generator, and a resistor, to
measure the capacitance of a length of cable. Compare your measurement
results to the value you obtain with a capacitance meter. Make sure you
show your hand calculations.
Materials
1K resistor (any known value)
1 osciolloscope probes (10x Attenuation recommended)
Function Generator
Coaxial Cable
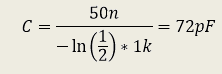
Equation:

Steps:
- ·
Configure function generator to produce
1MHz pulse with 50% duty cycle.
- ·
Measure signal with oscilloscope probe
and ensure it is compensated correctly
- ·
Build the schematic below.
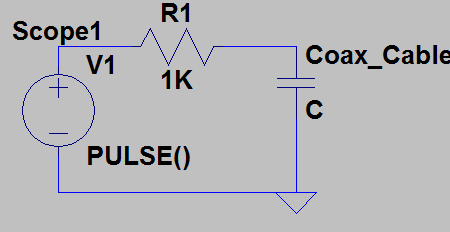
- ·
Connect the coaxial cable directly to the
oscilloscope and
display the outputs
- ·
Configure
Oscilloscope Measure function to display td and record that value
- ·
Using this value and the equation solve for C
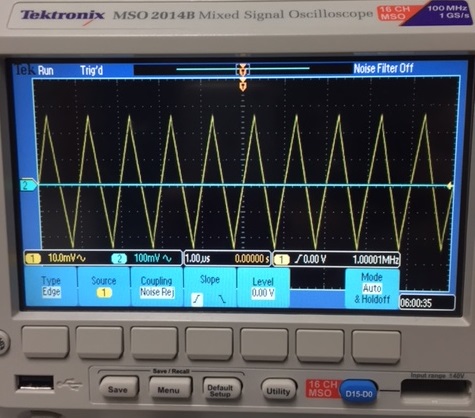
Hand Calc example
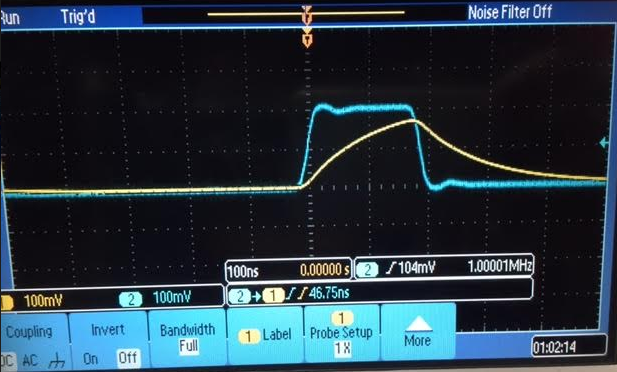
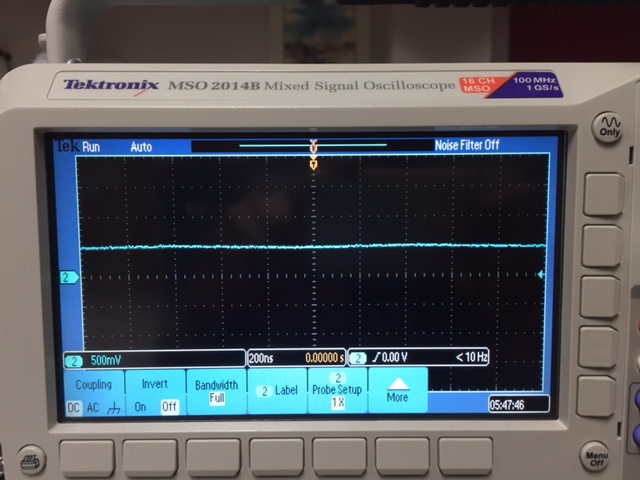
Waveform with td = 46.75ns (approx 50ns)
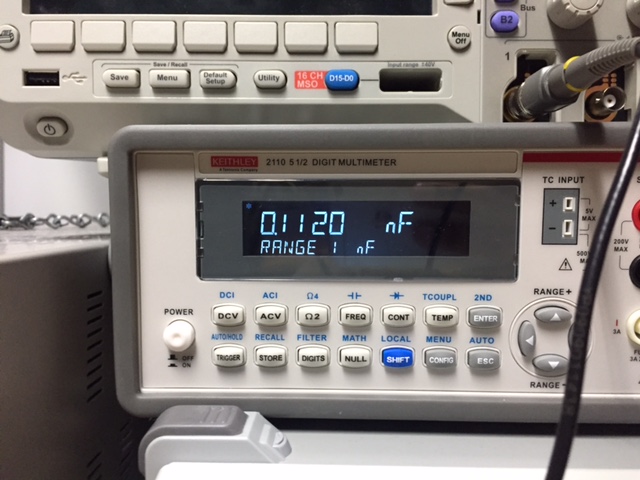
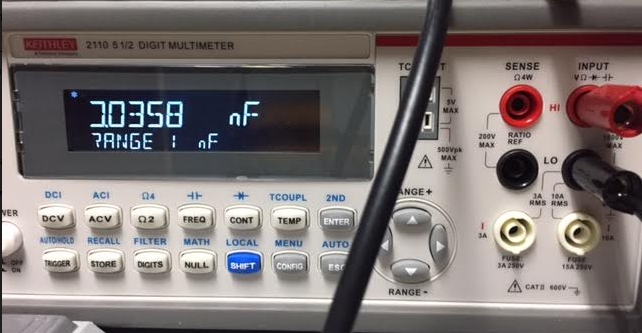
Measuring
the Coaxial cable with a mutlimeter we get 112 pF which is a
significant difference, subtracting the stray capacitance measured
with no load we get a much more satisfying result of 76pF
| Experimental Result | Measured |
| Coaxial Cable | 72pF | 76pF |
***************************************************************************************************************************************************************
EXP 6: Build a voltage divider using two 100k resistors. Apply a 0 to 1 V pulse at 1 MHz to the divider's input. Measure,
and show in your report, the output of the divider when probing with a cable (having a length greater than or equal to 3 ft)
and then a compensated scope probe. Discuss and explain the differences
.
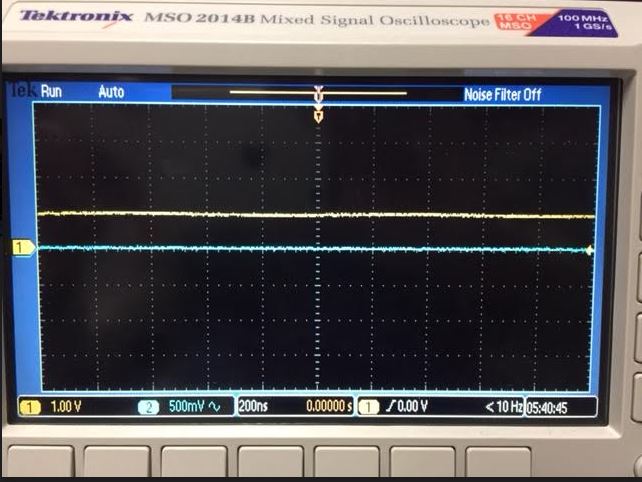
Blue is used for the attenuated cable measurements. Yellow is the results of using a coaxial cable.
The
DC component of the attenuated cable measurement is at 0.5 Volts, which
is precisesly what the output voltage should be for the described
circuit
The DC component of the coaxial cable measurement shows 1V, (Why explained below in conclusion)
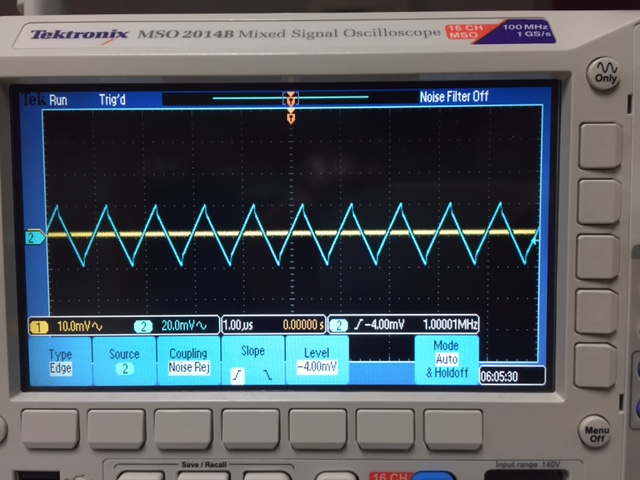
Next
we turn to the AC component of each. both signals appear as
triangle waves with peak voltages between 20 and 30 mV (unattenuated
slightly higher due to less
added impedence). The pulse
waveform appears as a triangle wave due to the 1 MHz pulse being much
too fast for the time constant created by probing.
In conclusion:
we
can see that while the DC component of a fast signal can be accurately
measured by a properly attenuated scope, since the capacitors are
practicly
ignored and the added resistance is accounted for before
outputting. (Note that whether the resistance is there or not, the
oscilloscope will account for it)
For the AC component of the
signal we can observe that the time constant is simply too large to
produce anything but a triangle wave for the 1MHz signal. Since the
oscilloscope
and cable impedences are fixed it is a significantly greater challenge to maintain the signals shape by attenuating.
***************************************************************************************************************************************************************
Exp
7: Finally, briefly discuss how you would implement a test point on a
printed circuit board so that a known length of cable could be
connected directly to the board and not load the circuitry on the board.
Knowing
the length of the cable that will load tells you how much capacitive
loading you must prepare for. Adding a capacitor much smaller
than the capacitive load you will be measuring with will prevent
the cable capacitance from having drastic effects on the accuracy of your measurements.
return