Lab 4 - EE420L
Authored
by Rodolfo Gutierrez
gutie284@unlv.nevada.edu
2/24/2016
Op-amps
II, gain-bandwidth product and slewing
- Estimate, using the
datasheet, the bandwidths for non-inverting op-amp topologies having
gains of 1, 5, and 10.
For the non inverting topology we have
BW * Gain = 1.3MEG Hz
At gain = 1
BW = 1.3MEG / 1 = 1.3 MEG Hz
At Gain = 5
BW = 1.3MEG / 5 = 260k Hz
At Gain = 10
BW = 1.3MEG / 10 = 130k Hz
- Experimentally verify
these estimates assuming a common-mode voltage of 2.5 V.
- Your report should
provide schematics of the topologies you are using for experimental
verification along with scope pictures/results.
- Associated comments
should include reasons for any differences between your estimates and
experimental results.
We can measure the bandwidth by finding the output voltage at 3db. To
put simply we measure the output at a low frequency then look for the
output response at higher frequencies. This is done with vout * 0.707.
| low frequency Pk-Pk vout | high frequency Pk-Pk vout | bandwidth |
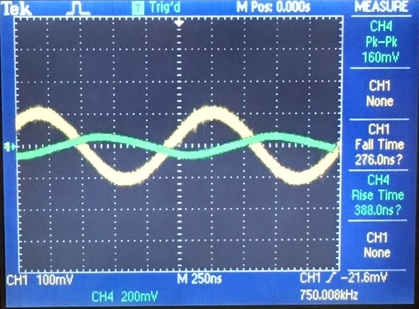
| Gain 1 | 237 mV | 168 mV | 750 kHz |
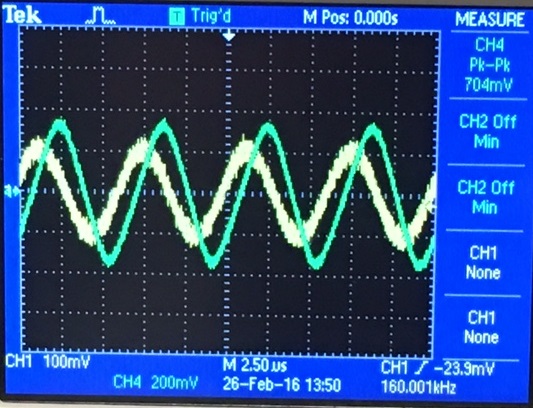
| Gain 5 | 980 mV | 693 mV | 160 kHz |
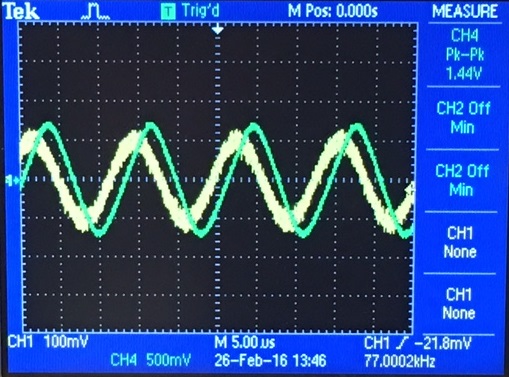
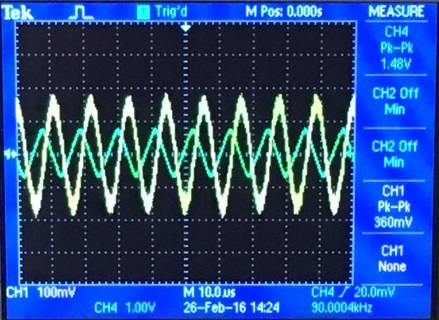
| Gain 10 | 2.1 V | 1.48 V | 77 kHz |
We see that the measured bandwidth is much lower than the calculated
bandwidth. This is probably due to the room temperature. We know from
the open loop frequency response
graph given from the data sheet we should expect a range for the
devices bandwidth, using the lower range we see that the unity
frequency is about 900 kHz. Using that we get 900kHz for the gain of 1,
180kHz for the gain of 5, and 90kHz for the gain of 10. With our
recorded values we can state that the op-amps bandwidth is operation in
the lower range.
- Repeat these steps
using the inverting op-amp topology having gains of -1, -5, and
-10.
For the inverting topology we have
BW * (1+R2/R1) = 1.3MEG Hz
At gain = -1
BW = 1.3MEG / (1+1) = 650k Hz
At Gain = -5
BW = 1.3MEG / (1+5) = 216.66k Hz
At Gain = -10
BW = 1.3MEG / (1+10) = 118.1k Hz
| low frequency Pk-Pk vout | high frequency Pk-Pk vout | bandwidth |
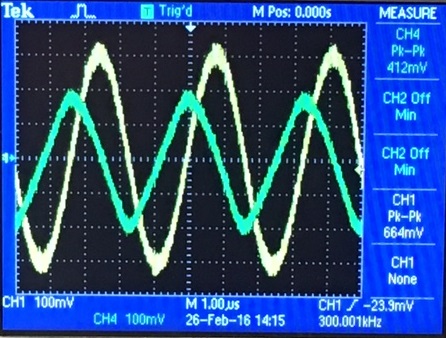
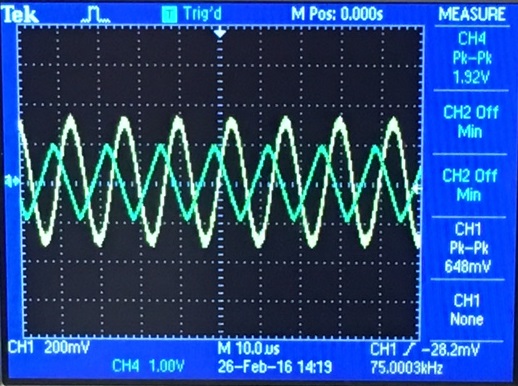
| Gain -1 | 664 mV | 469.4 mV | 300 kHz |
| Gain -5 | 2.08 V | 1.47 V | 90 kHz |
| Gain -10 | 2.71 V | 1.91 V | 75 kHz |
Once
again we see that the theoretical bandwidth is much higher than the
measured bandwidth. If we use the same assumption from the last
experiment we get the following. At unity gain = 900kHz you will have
450kHz for the gain of -1, 180kHz for the gain of -5, and 90k for the
gain of -10. With the measured results from the inverting
topology we can confirm that the bandwidth is operating at the lower
range given from the datasheet.
- Design two circuits
for measuring the slew-rate of the LM324. One circuit should use a
pulse input while the other should use a sinewave input.
- Provide comments to
support your design decisions.
- Comment on any
differences between your measurements and the datasheet’s
specifications.
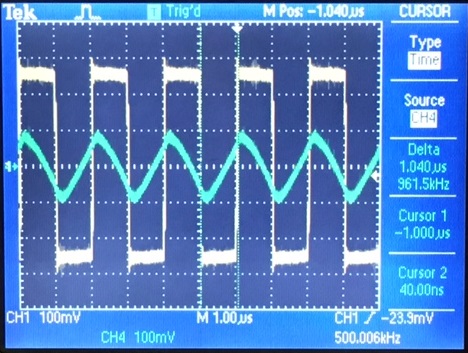
To find the slew rate the gain of 10 topology was used, this is so that
we can see the raising voltage. Then the frequency was greatly
increased until the output voltage resembles a sawtooth wave form, with
this we take the raising voltage divided by the rise time. By using the
cursor function from the oscilloscope we are able to
measure the raise time of vout. For the square wave we see vout raises
200 mV, at raise
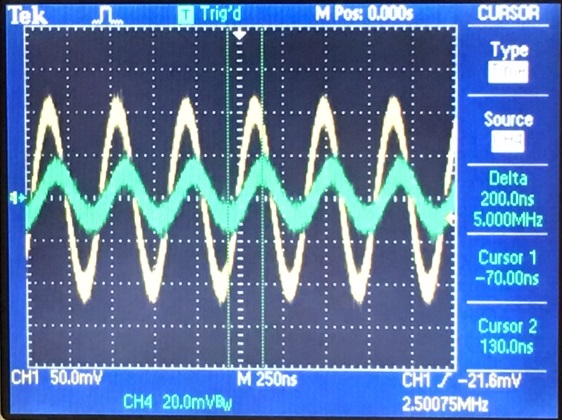
time = 1.04 us we have 0.192 V/us. For the sine wave we have the same
voltage but a rise time of 200ns, giving us about about 0.2 V/us.

We find that the measured value is within the ballpark range from the datasheet result.
Return