Lab 1 - EE420L
Authored
by Rodolfo Gutierrez
gutie284@unlv.nevada.edu
1/29/2016
Reviewing of basic RC circuits.
Experiment 1
Figure 1.21

Hand Calculations
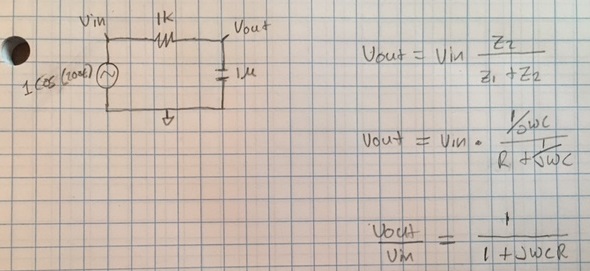
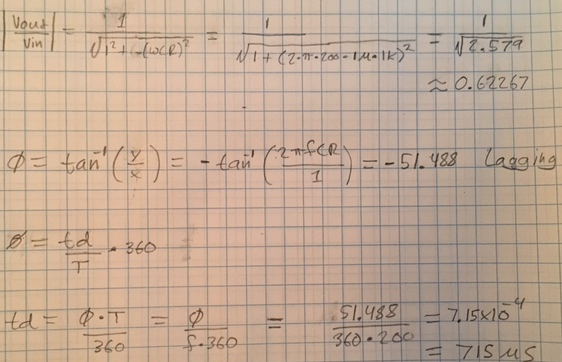
Magnitude = 0.62267 Phase = -51.488 degrees Time Delay = 715 microseconds
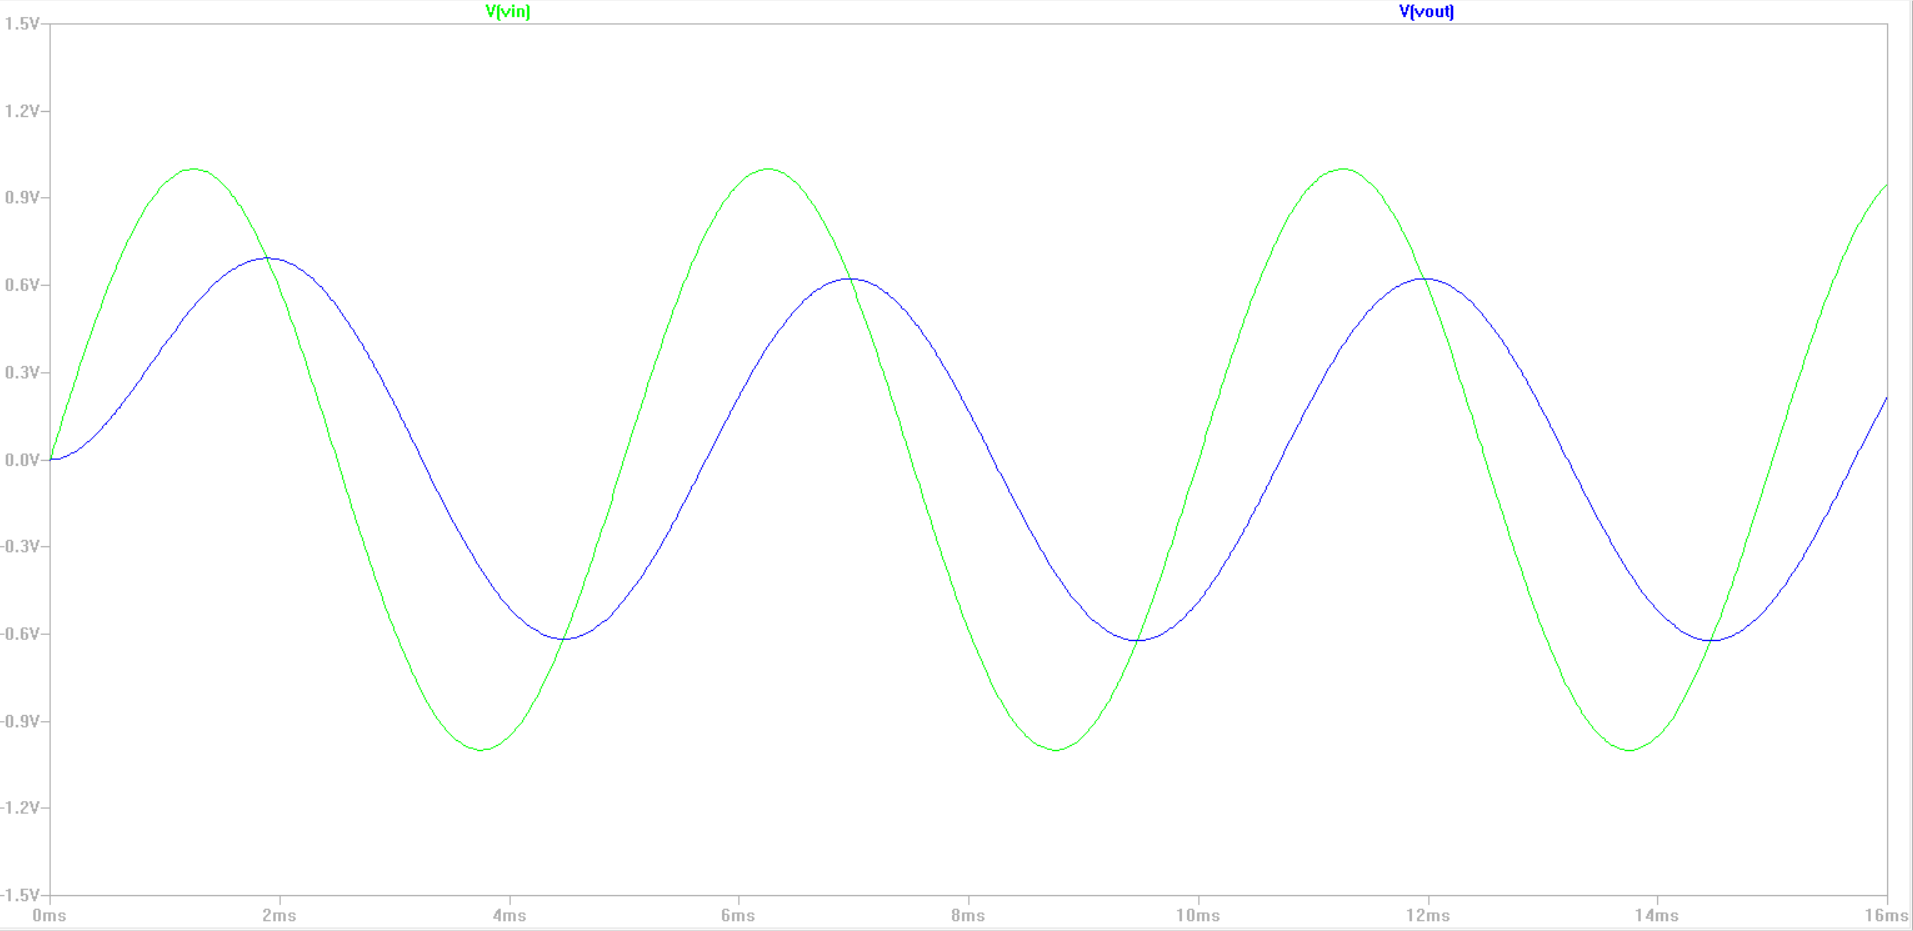
Simulation for figure 1.21
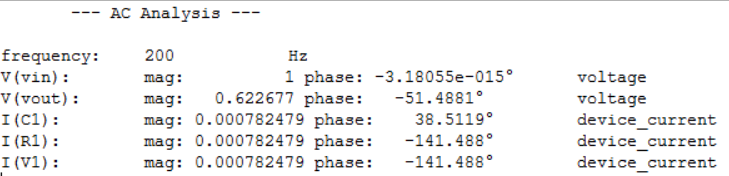
The hand calculations and simulation results show that there is match for Vout's peak voltage and a match with the phase angle.
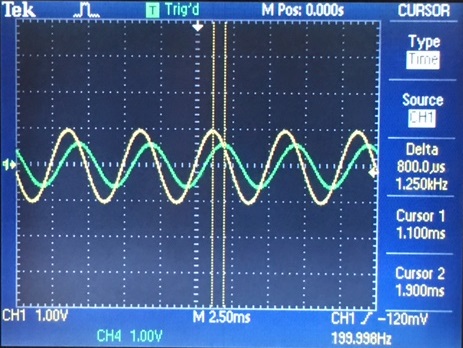
Simulated and measured waveforms for figure 1.21
When we compare the scope image with the spice simulation we see that
there is a match in both phase and amplitude
Table 1.21
| Calculated | Simulated | Measured |
| Magnitude | 0.62267 V | 0.622677 V | 0.6 V |
| Phase | -51.488 degrees | -51.4881 degrees | -57.6 degrees |
| Time Delay | 715 microseconds | 715 microseconds | 800 microseconds |
This table shows that there is a match between simulated and calculated
values, however the measured results are different. The lower voltage
was a result of using a 1.1k resistor, the different time delay was
caused by poorly measuring the scope with the cursors. The scope image
shows a 800 microsecond time display, which was used in calculating the
phase angle.
Experiment 2
Figure 1.22
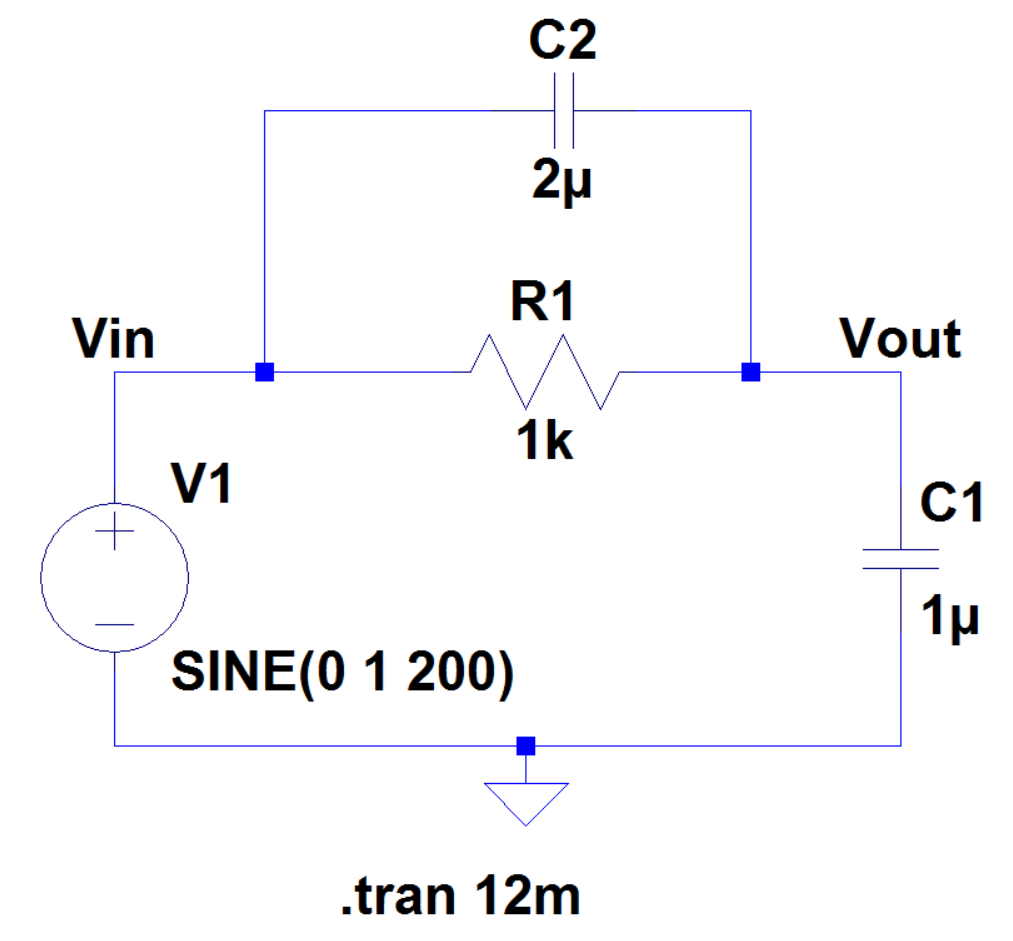
For experiment 2 we added in a 2 microfarad capacitor in parallel with our resistor.
Hand Calculations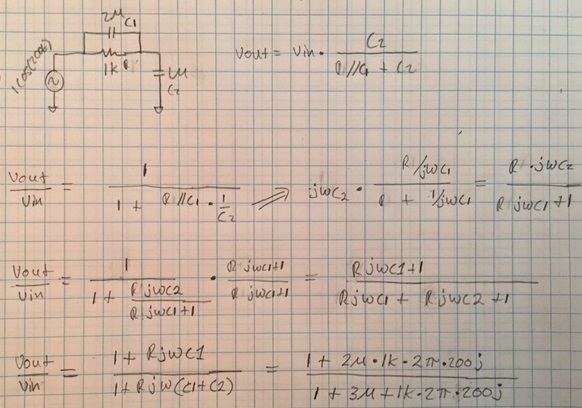
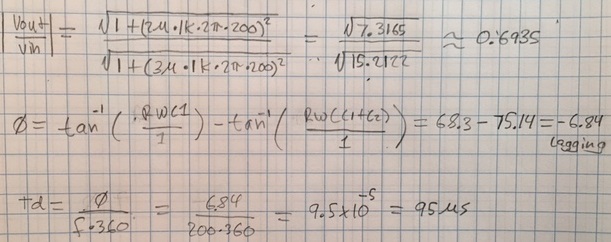 Magnitude
 = 0.6935
Phase = -6.84 degrees
Time Delay = 95 microseconds
Simulation for figure 1.22
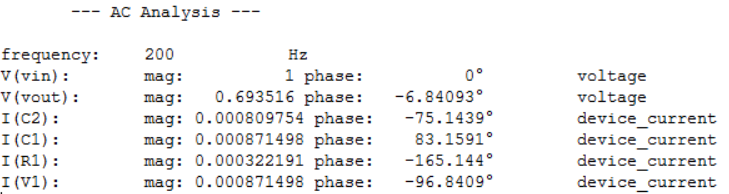
Comparing
the simulation and hand calculation shows that we should expect about
0.7 V as our outputs peak which a lagging phase of 6.84
Simulated and measured waveforms for figure 1.22
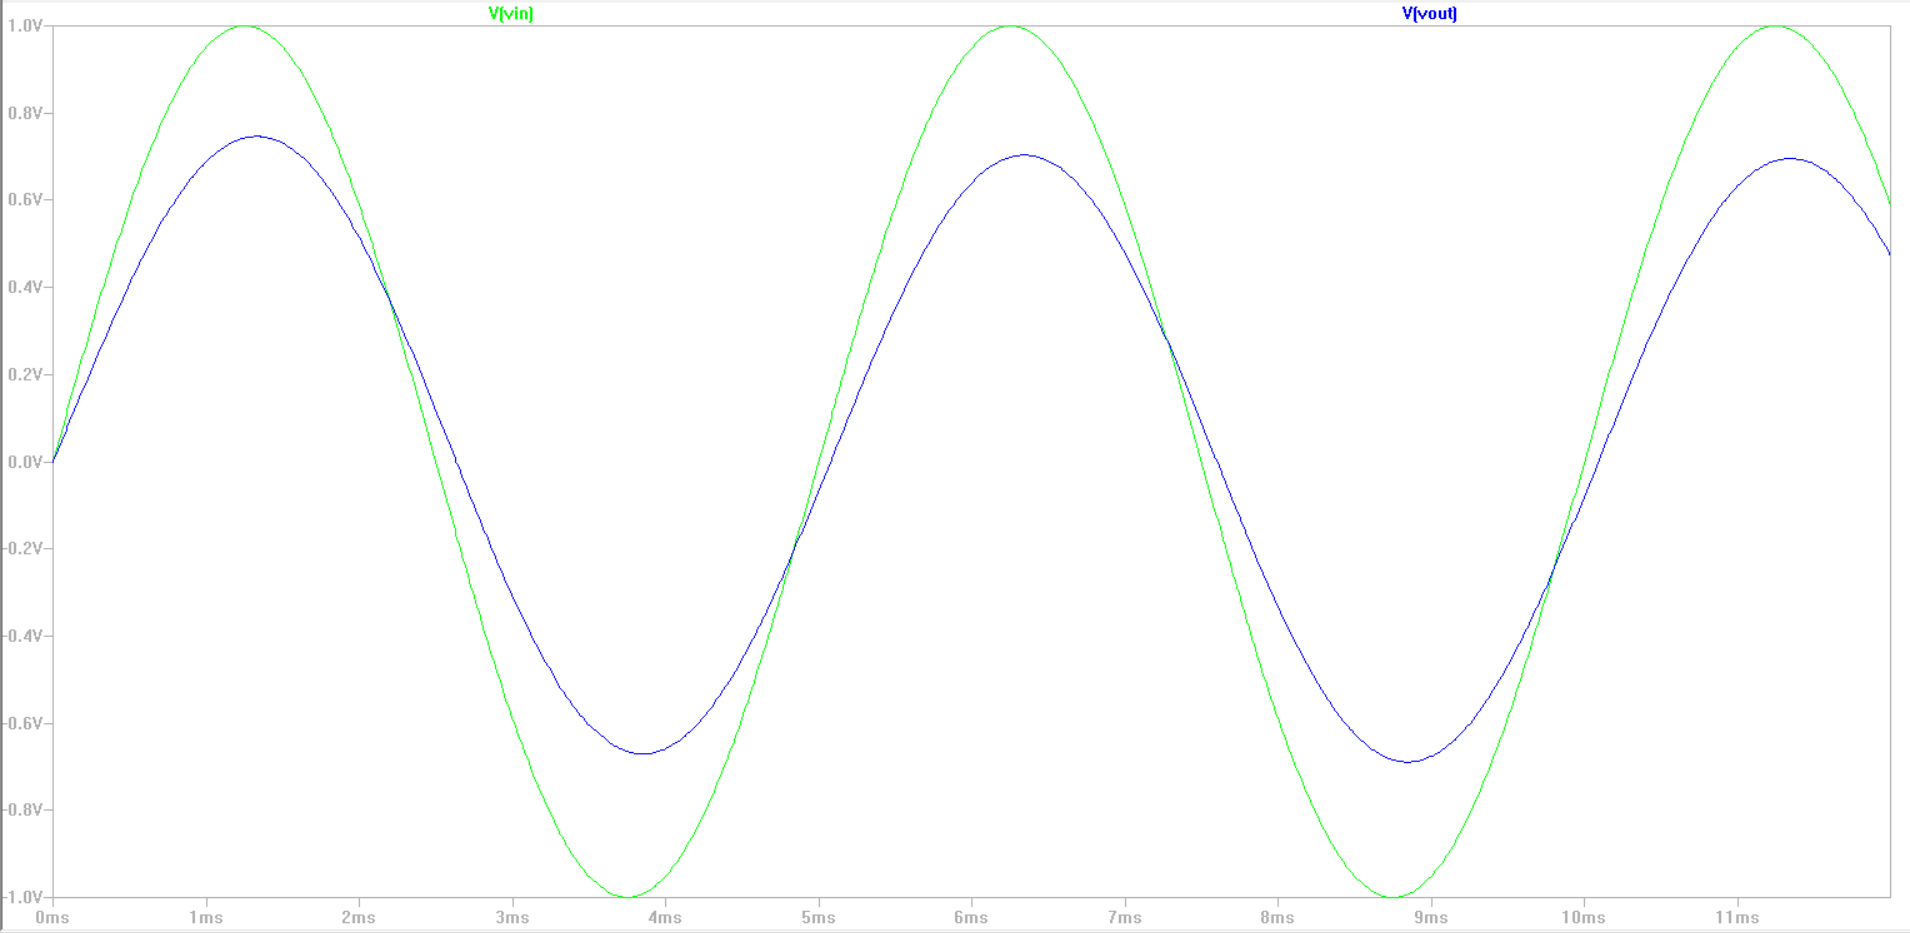
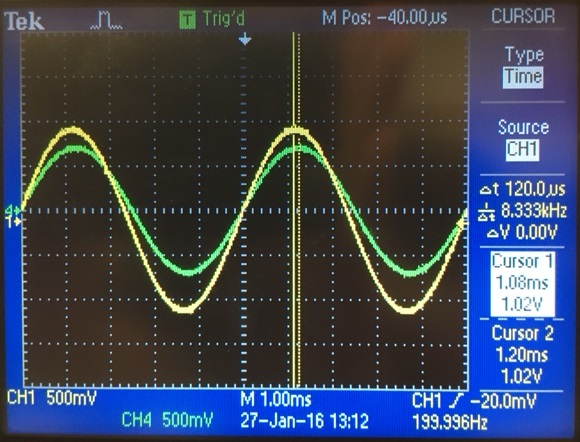
Since
the phase angle is low our Vin and Vout waveforms are rather close to
each other in phase. Our peak to peak measurment in time shows a time
delay of 120 microseconds, meaning we are off the calculated and
simulated time delay by about 25 microseconds. The Vout peak shown in
channel 4 peaks at about 0.7V which nearly matches the calculated and
simulated results.
Table 1.22
| Calculated | Simulated | Measured |
| Magnitude | 0.6935 V | 0.693516 V | 0.7 V |
| Phase | -6.84 degrees | -6.84093 degrees | -8.64 degrees |
| Time Delay | 95 microseconds | 95 microseconds | 120 microseconds |
We have matched results for our simulated and calculated values. The
measured peak voltage for Vout did match the expected values from both
the simulated and calculated values. The time delay was once again a
result of bad measurments from the cursors. Since the time delay
measurment from the scope was used to calculate the measured phase
shift, the phase result was off by about 2 degrees.
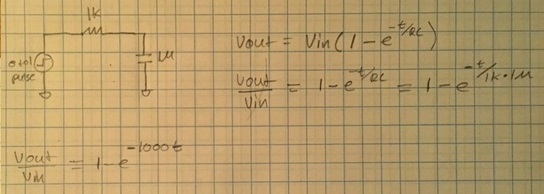
Experiment 3
Figure 1.24
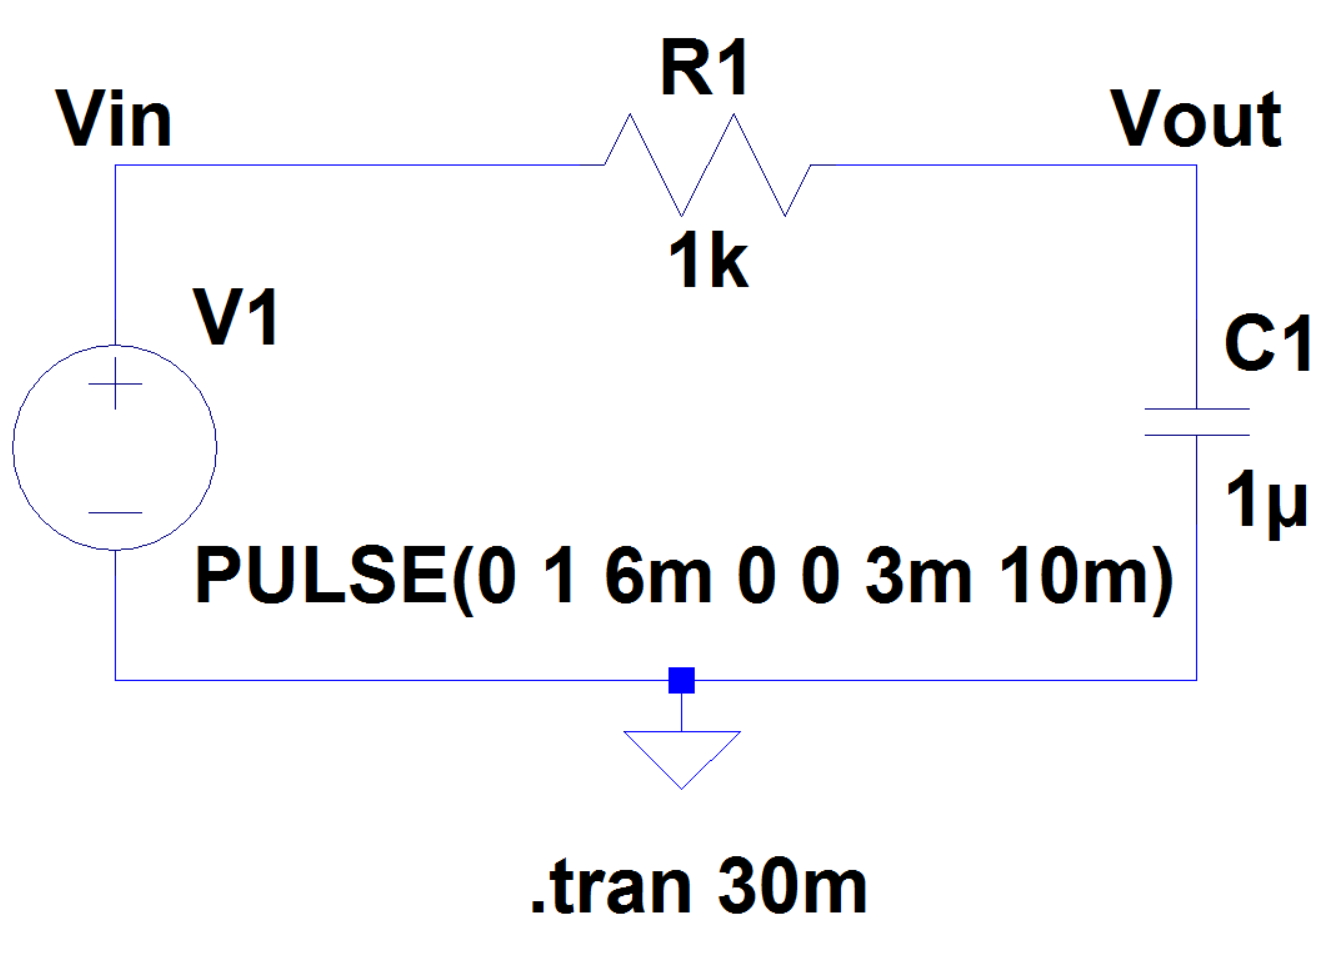
For
experiment 3 we are using the same circuit used in experiment 1,
however we are using a square waveform instead of a sinewave
Hand Calculations
Simulated and measured waveforms for figure 1.24
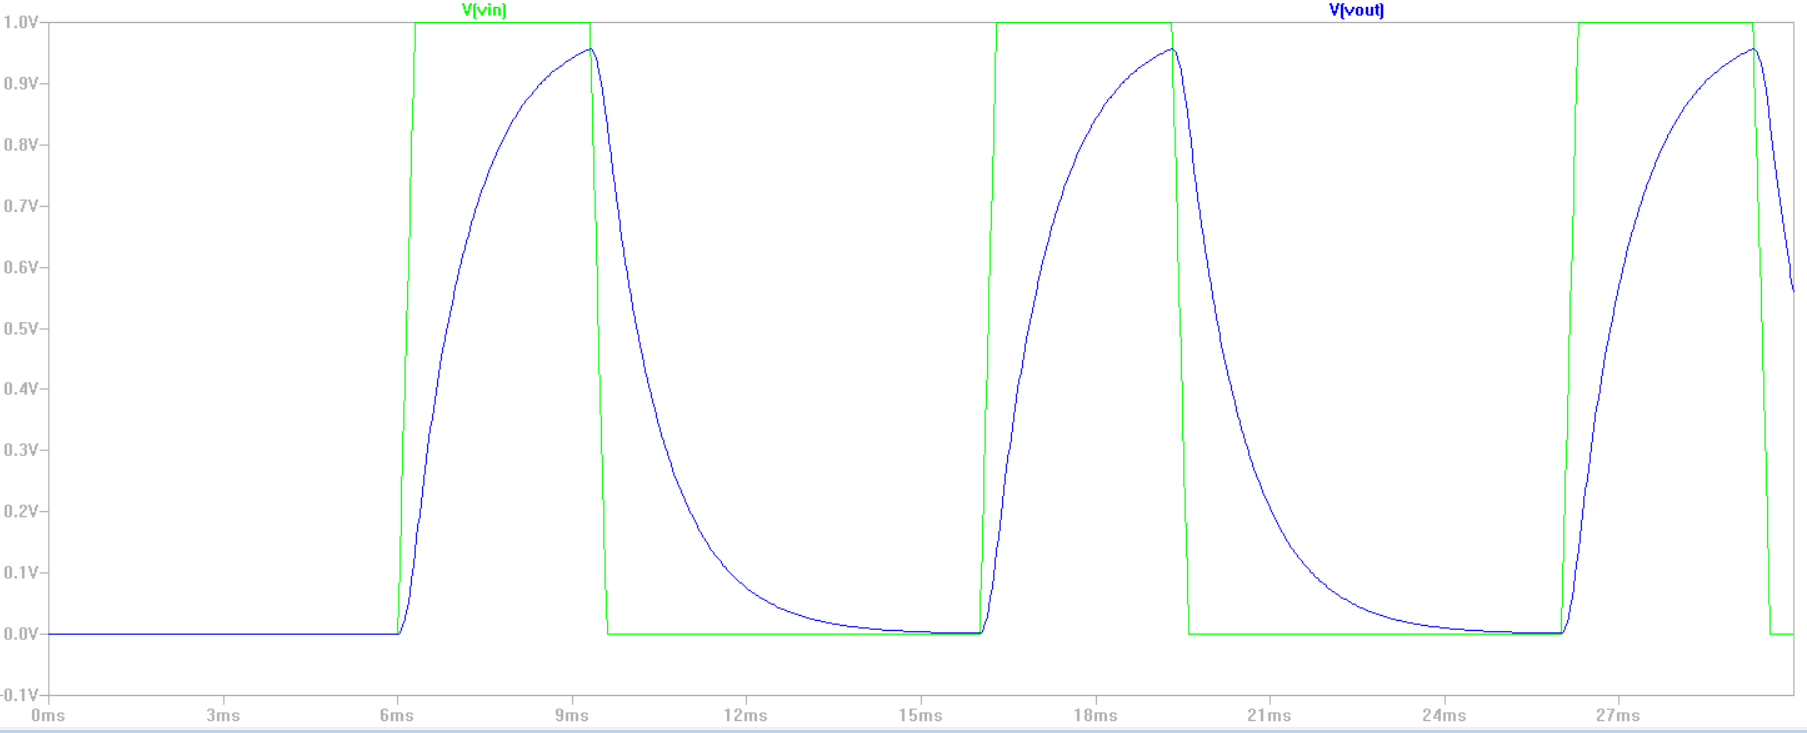
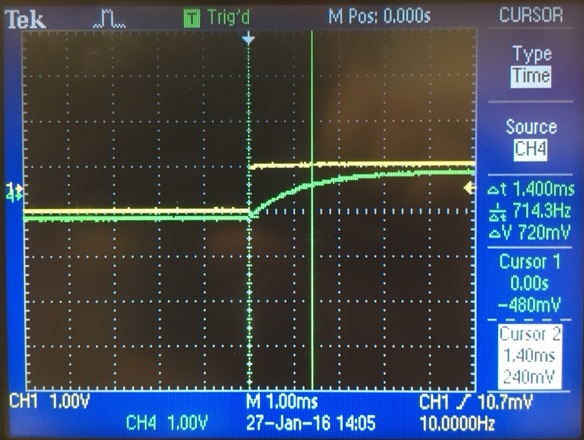
The
waveform shows that when Vin is 1 V the capacitor charges at the rate
of 1-e^(-t/RC) and when Vin is equal to zero the capacitor discharges
at the rate of e^(-t/RC). Both the simulated and measured
waveforms shows that Vout reachs a peak slighlt above 0.9 V. The
scope image shows that at about 1.4 ms the Vout voltage would have
reached a voltage of 720mV while in our simulated waveform Vout reaches
0.7 volts at about 1.2 ms after Vin becomes 1 V.
Conclusion
Most of the data shown has been consistant with each other. With the only issues being the scope
measurements, however the error caused by the measurments have been low
and still shows that the data has been consistant with our expected
results.
Return