EE 420L - Lab 1
Review of basic RC circuits
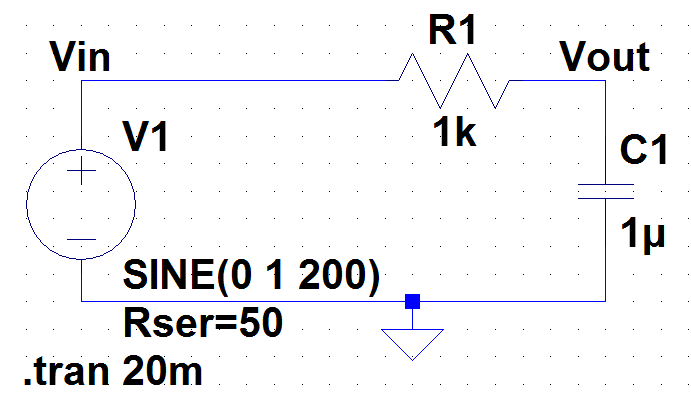
1.21)
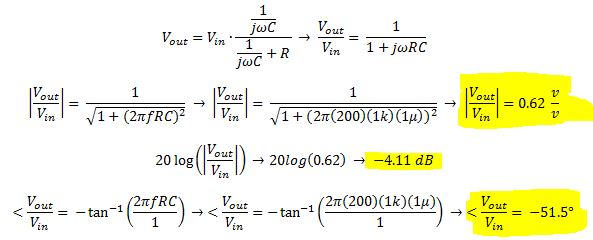
We use the equations provided by the book, or easily derived, help us calculate significant values such as gain, magnitude and phase.
Calculations:
The simulated results of source voltage and output voltage, as a function of time, are provided below from LTSpice.
Simulation: (Vin = green, Vout = blue)
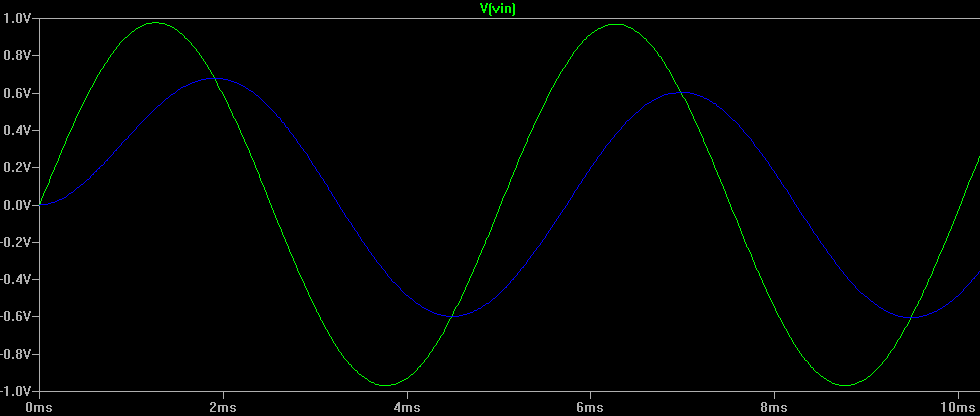
The output voltage has a peak voltage of about 0.6v, consistant with our calculations.
Output Voltage Magnitude and Phase:
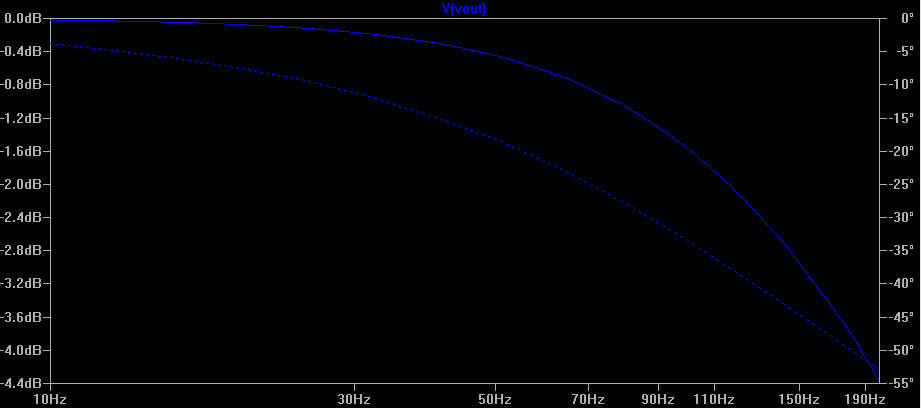
Magnitude approaches -4.4 dB and phase is about 5.25 degrees, very close to our calculations.
Lastly, here is the actual results recorded from our oscilloscope.
Screen shot of waveforms from oscilloscope tool (Vin = blue, Vout = red)
Results:
| Gain (v/v) | Magnitude (dB) | Phase (degree) | |
| Calculated | 0.62 | -4.11 | -51.5 |
| Measured | 0.63 | -4.4 | -52.5 |
| Accuracy | 98.4% | 93.4% | 98.1% |
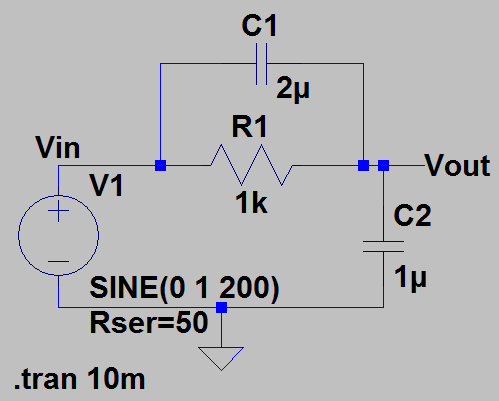
We use the equations provided by the book, or easily derived, help us calculate significant values such as gain, magnitude and phase. Note that Z is the parallel resistance of R and C1.
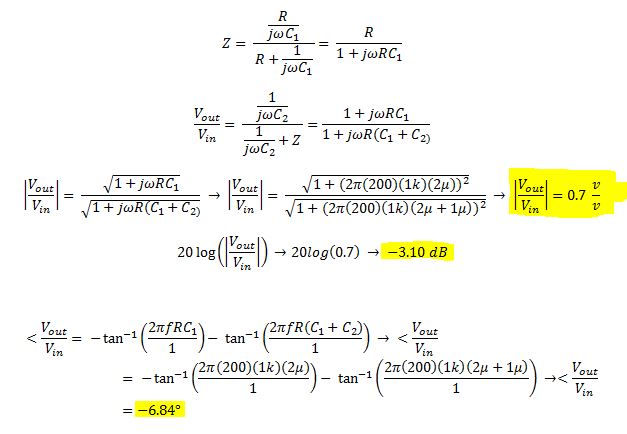
Calculations:
The simulated results of source voltage and output voltage, as a function of time, are provided below from LTSpice.
Simulation: (Vin = green, Vout = blue)
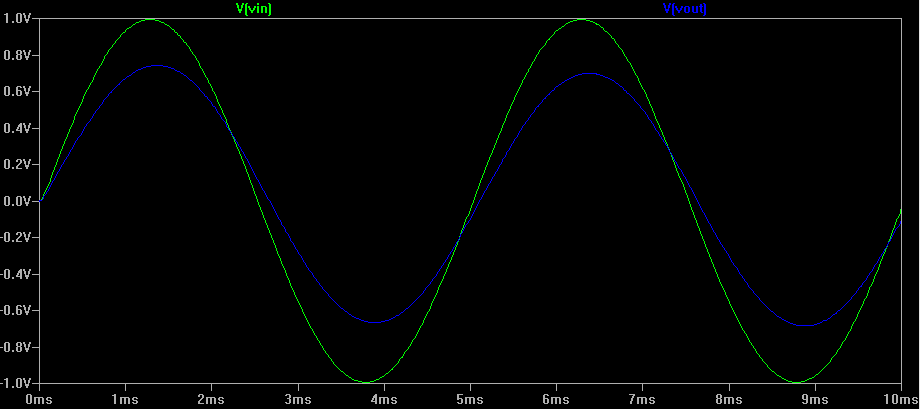
The output voltage has a peak voltage of about 0.75v, consistant with our calculations.
Notice how Vout and Vin are almost completely in phase.
Output Voltage Magnitude and Phase:
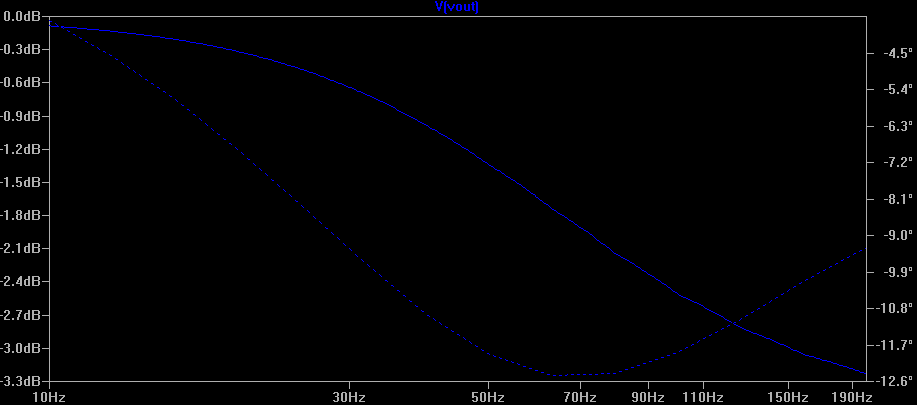
Magnitude approaches -3.2 dB and phase is about 9.3 degrees, close to our calculations.
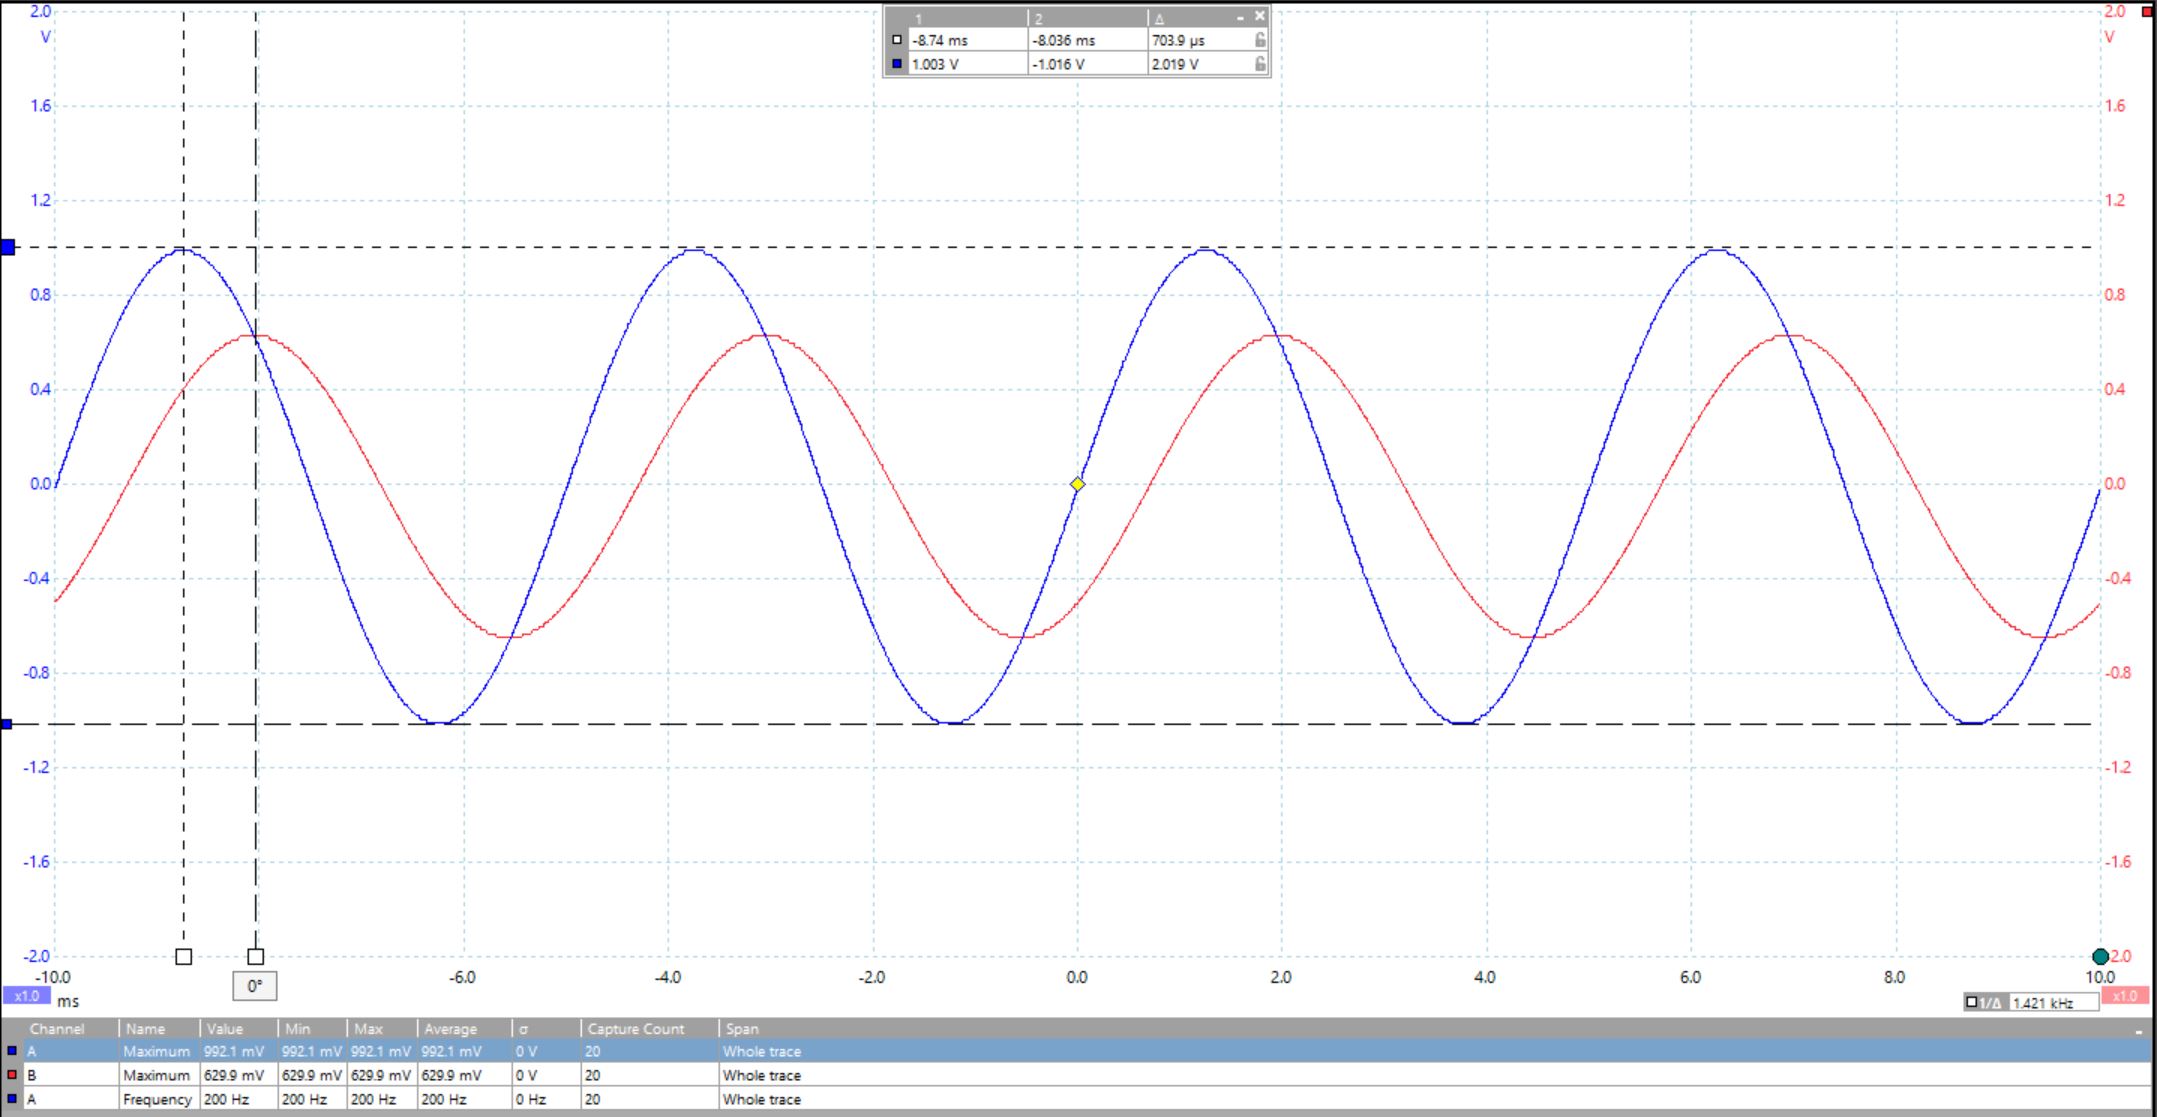
Lastly, here is the actual results recorded from our oscilloscope.
Screen shot of waveforms from oscilloscope tool (Vin = blue, Vout = red)
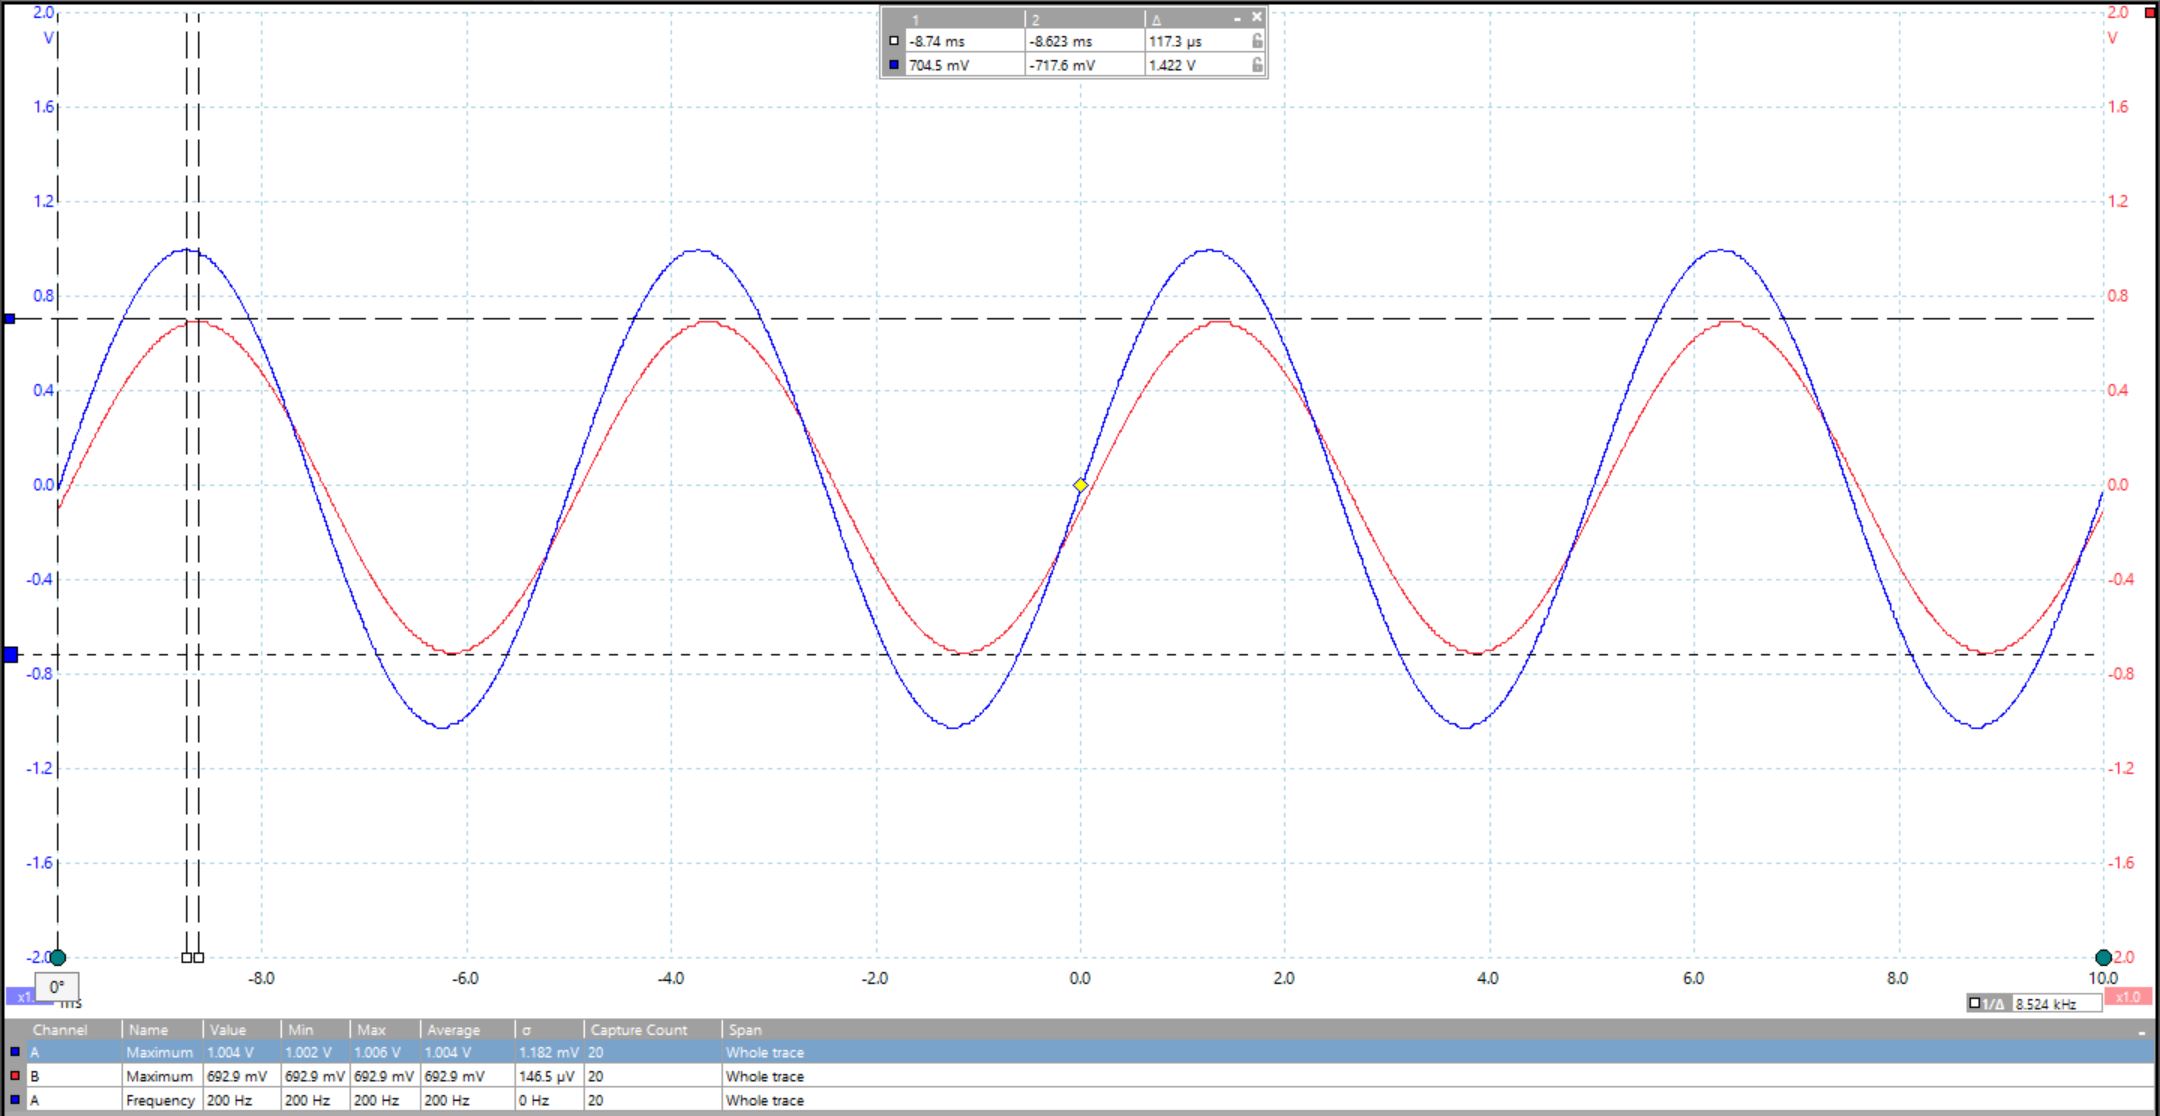
Not surprisingly,our oscilloscope read out agrees with our LTSpice simulation.
Results:
| Gain (v/v) | Magnitude (dB) | Phase (degree) | |
| Calculated | 0.70 | -3.10 | -6.84 |
| Measured | 0.75 | -3.20 | -9.30 |
| Accuracy | 93.3% | 96.9% | 73.5% |
1.24)
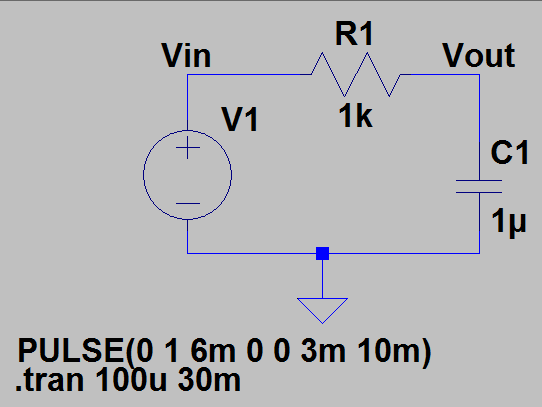
For this circuit, our main goal is to observe the response of the circuit when a DC pulse is applied. We want to note how the capacitor charges and discharges with each pulse.
The simulated results of source voltage and output voltage, as a function of time, are provided below from LTSpice.
Simulation: (Vin = green, Vout = blue)
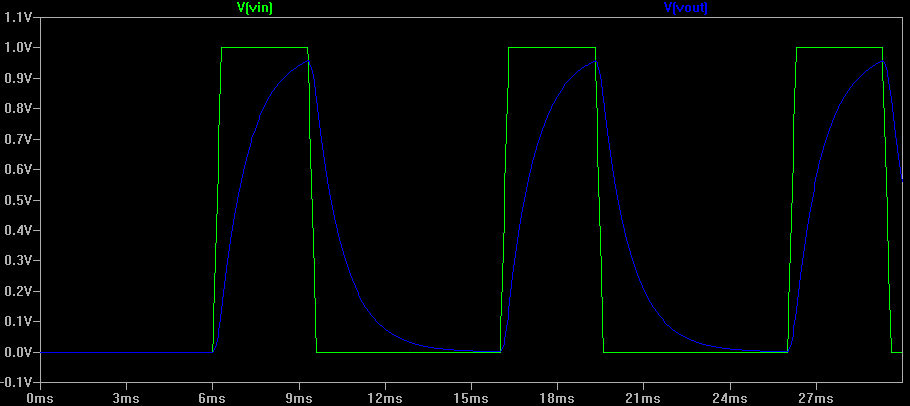
The time that Vout curves up is effectively the step responce of the RC circuit where the capacitor is charging. Alternately, the time that Vpout curves down is the (negative) step responce of the RC circuit where the capacitor is discharging. Of course, the capacitor never charges up completely, as noted by the blue peak (Vout) never touching the green peak (Vin). This can be attributed to the fact that the resistor holds some amount of voltage across it.
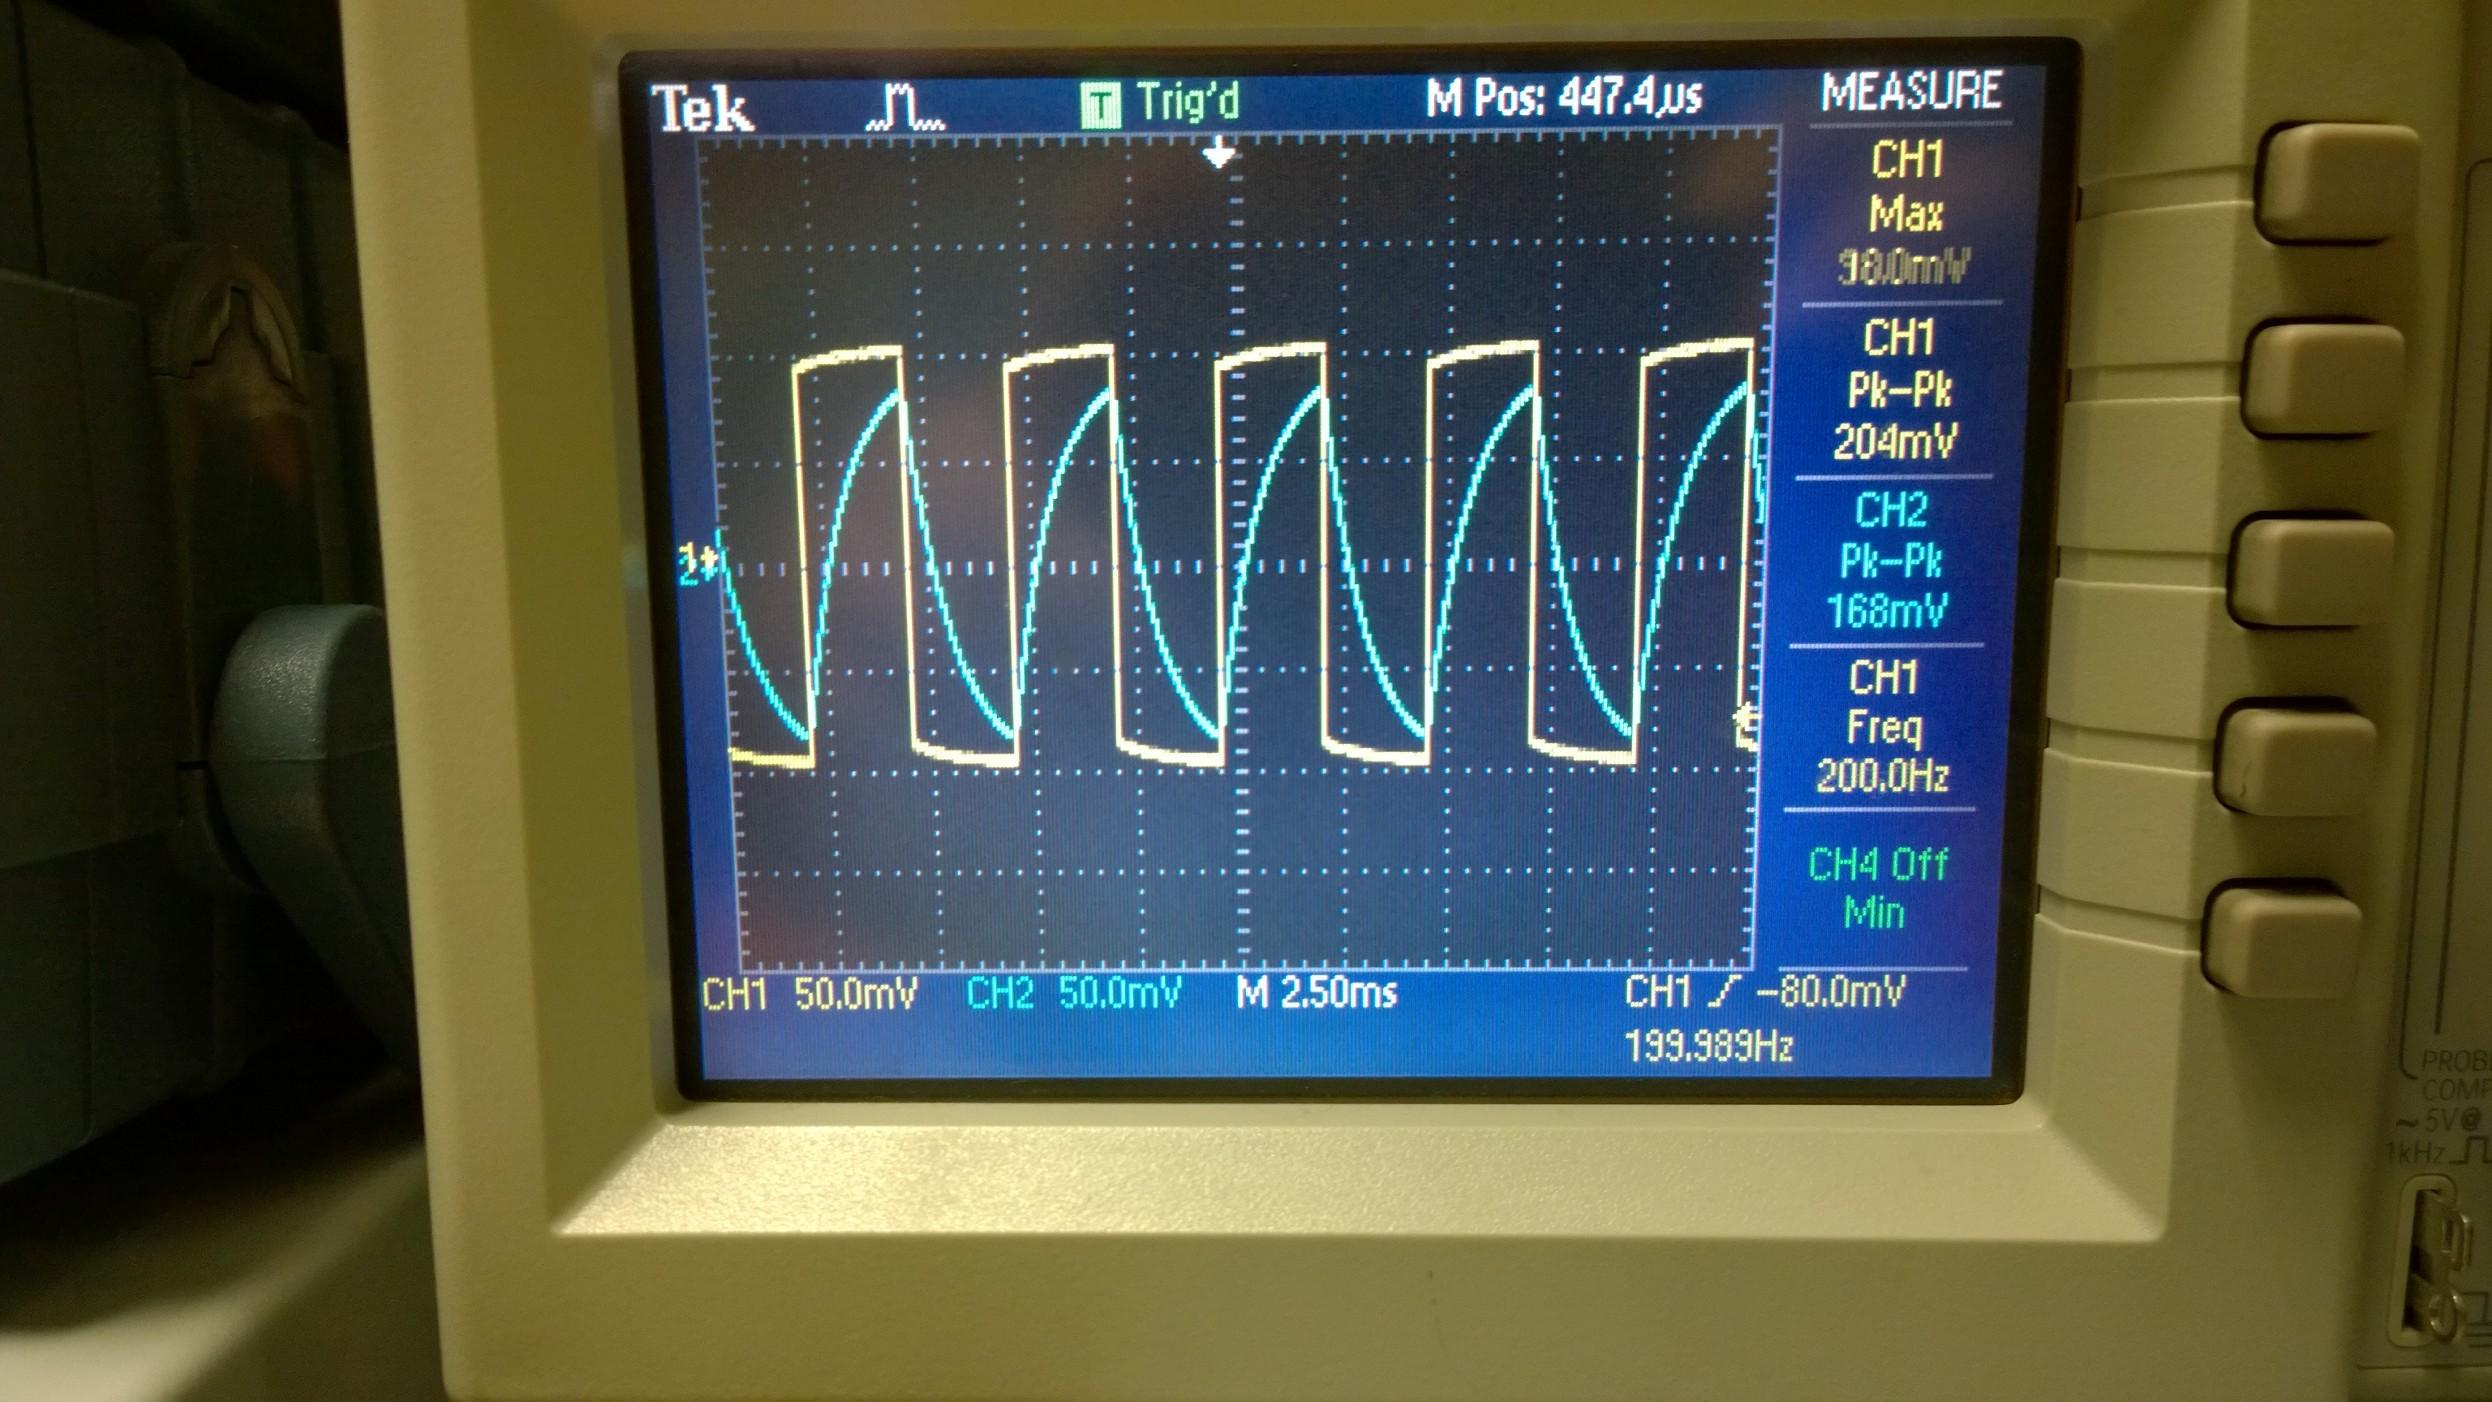
Screen shot of waveforms from oscilloscope tool (Vin = blue, Vout = red)
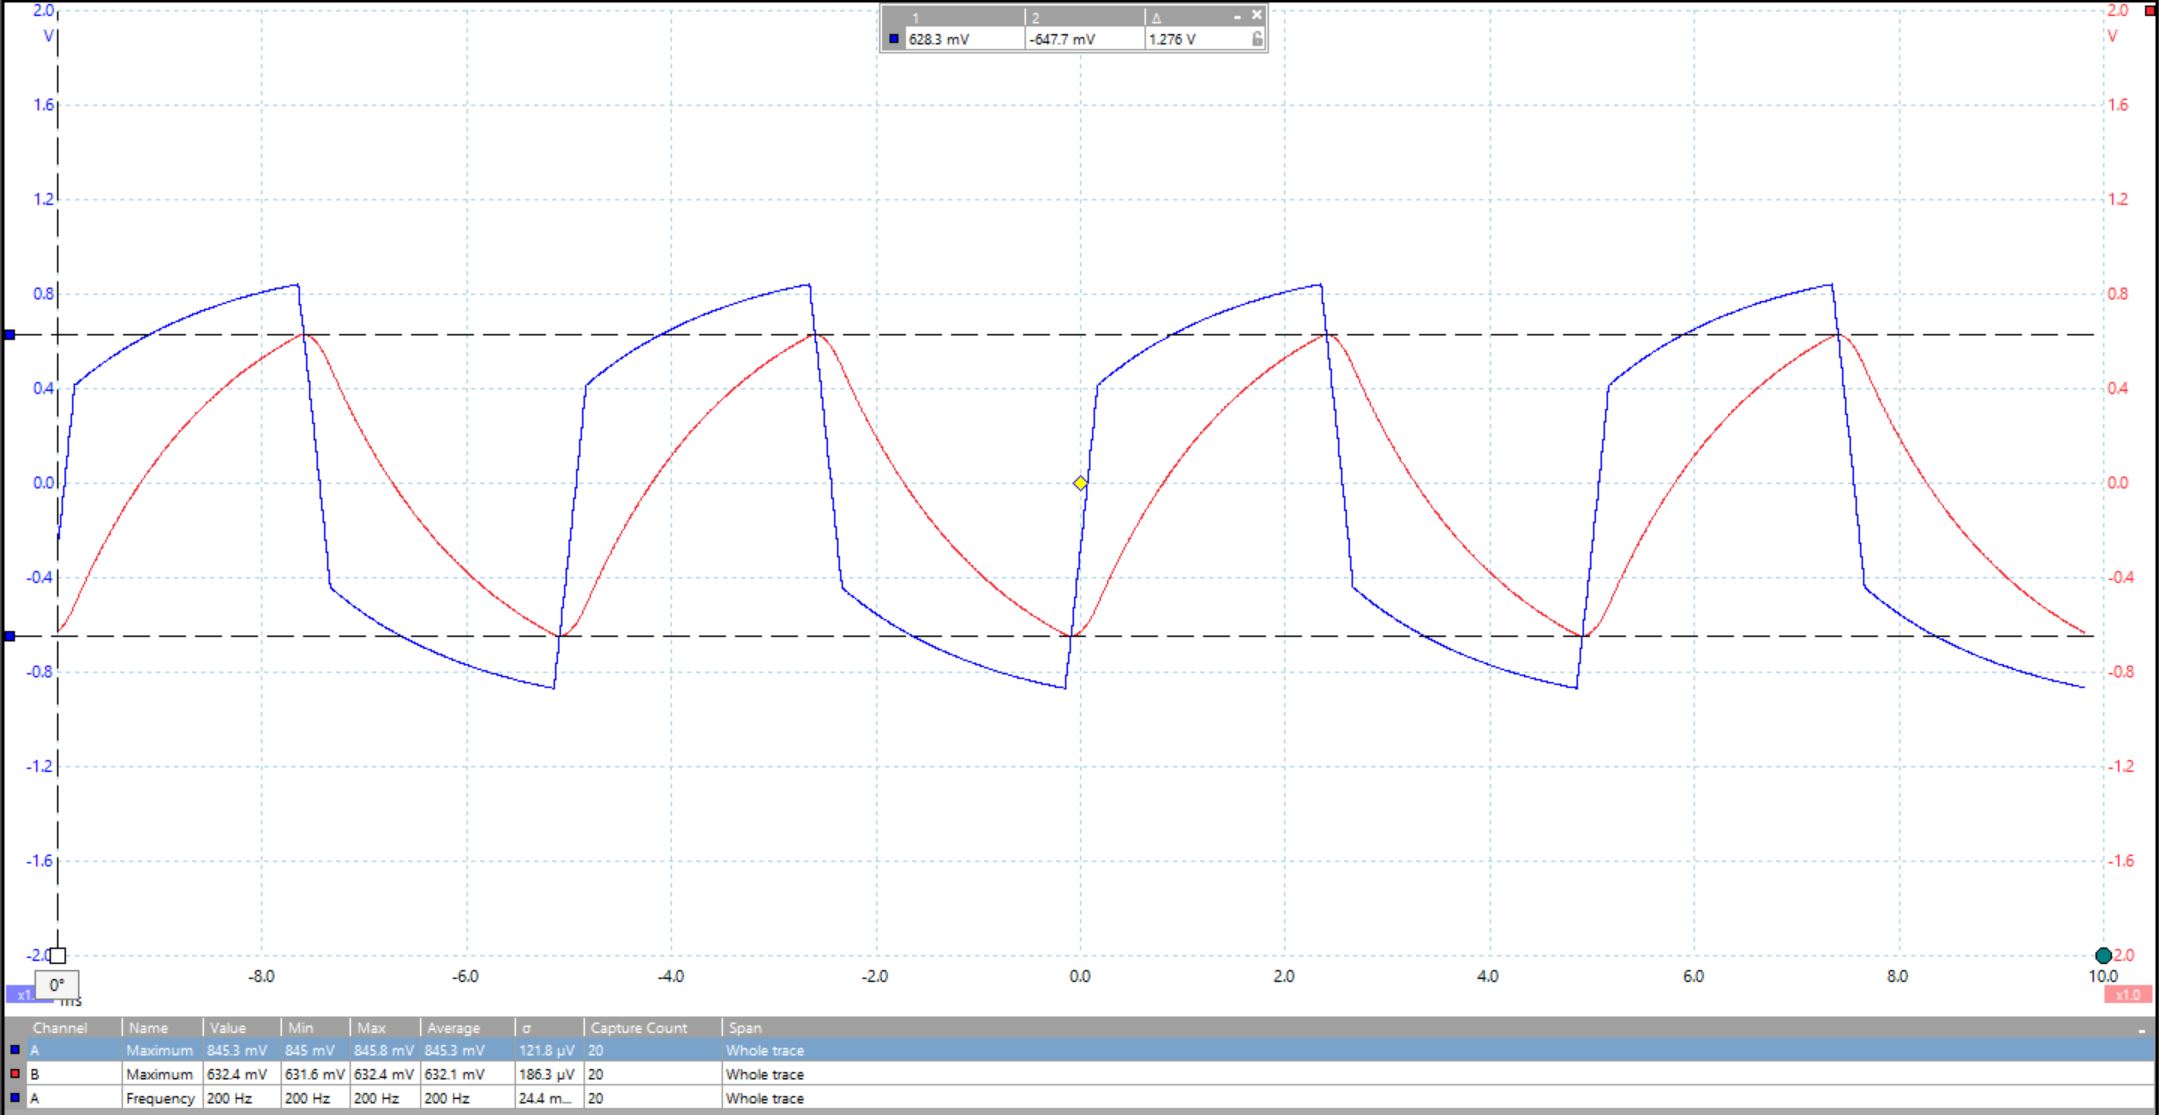
Not surprisingly,our oscilloscope read out agrees with our LTSpice simulation albeit a little condensed. Interestingly enough, in this read out, the capacitor can not fully discharge in time, as noted by the fact that the red line (Vout) never touches the bottom of the blue line (Vin).
Alternative oscilloscope waveform