Lab 8 - EE 420L
Authored
by
Your Name, Steven Leung
4/15/15
Lab
description
The
main purpose of this lab is to charactreize the MOSFET devices on teh
CD4007 transistor array. This includes ID V. VGS , ID V. VDS, and ID V.
VGS varying VSD curves. We will find those curves for both nmos and
pmos transistors on the chip.
Pre-lab work
- Review the datasheet for the CD4007.pdf CMOS transistor array.
- Ensure
that you understand how the bodies of the NMOS are tied to pin 7 (VSS,
generally the lowest potential in the circuit, say ground) and that the
bodies of the PMOS are tied to pin 14 (VDD, generally the highest
potential in the circuit, say + 5V).
Experimental Results
NMOS device
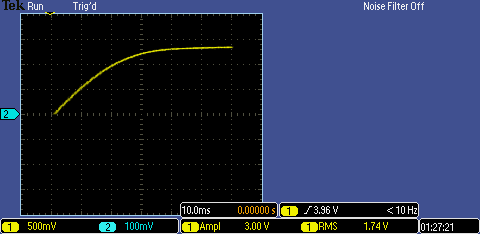
1) ID v. VGS (0 < VGS < 3 V) wioth VDS =3V
2) ID v. VDS (0 < VDS < 5 V) for VGS varying from 1 to 5 V in 1 V steps
VGS=4 | 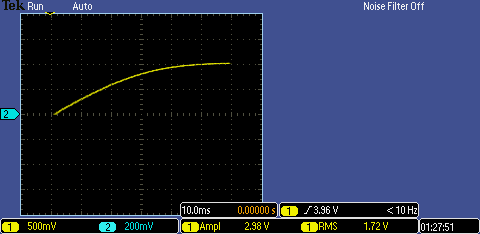
VGS=5 |
For
the pictures above using the IV function on oscilloscope. We
represendted the sweeping of VGS or VDS with a triangle wave that
is at 100% duty cycle making it a sawtooth signal. We added a 100 ohm
resistor to the source to ground . The X axis of the IV function of the
oscilloscope is from the function generator and the Y axis of the IV
function is taken across the 100 ohm resistor to ground. Therefore the
X axis is VGS or VDS and the y axis divided by the 100 ohm resistor is
ID. Therefore to interpret the IV curve, we read the x axis as normal
and the y axis divided by 100 to get the actual current.
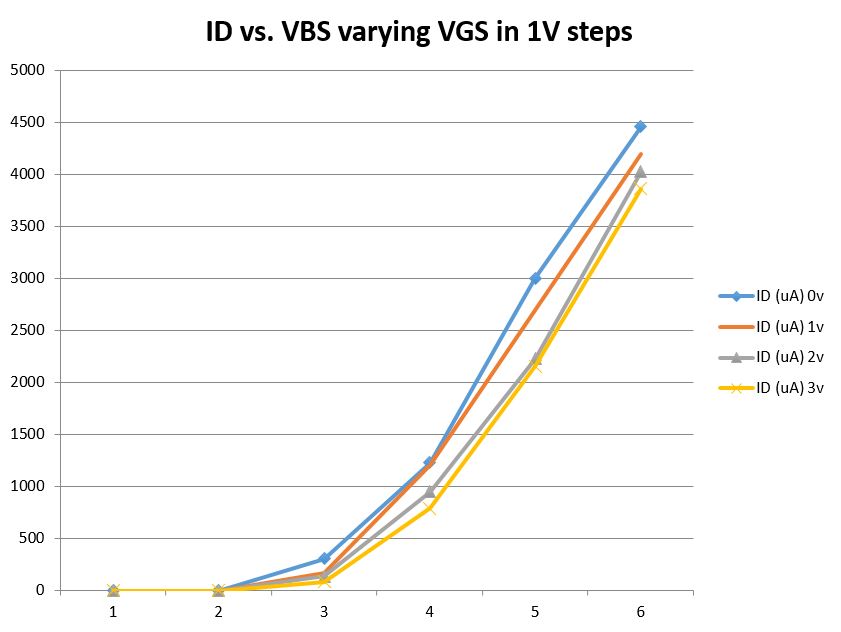
3) ID v. VGS (0 < VGS < 5 V) with VDS = 5 V for VSB varying from 0 to 3 V in 1 V steps.
Note
that in these plots, we decreased VSB (increase VBS) instead but the
same results yields, the threshold voltage is reduced as VSB decreases.
For
the pictures above using the IV function on oscilloscope. We
represendted the sweeping of VGS or VDS with a triangle wave that
is at 100% duty cycle making it a sawtooth signal. We added a 100 ohm
resistor to the source to ground . The X axis of the IV function of the
oscilloscope is from the function generator and the Y axis of the IV
function is taken across the 100 ohm resistor to ground. Therefore the
X axis is VGS or VDS and the y axis divided by the 100 ohm resistor is
ID. Therefore to interpret the IV curve, we read the x axis as normal
and the y axis divided by 100 to get the actual current.
PMOS
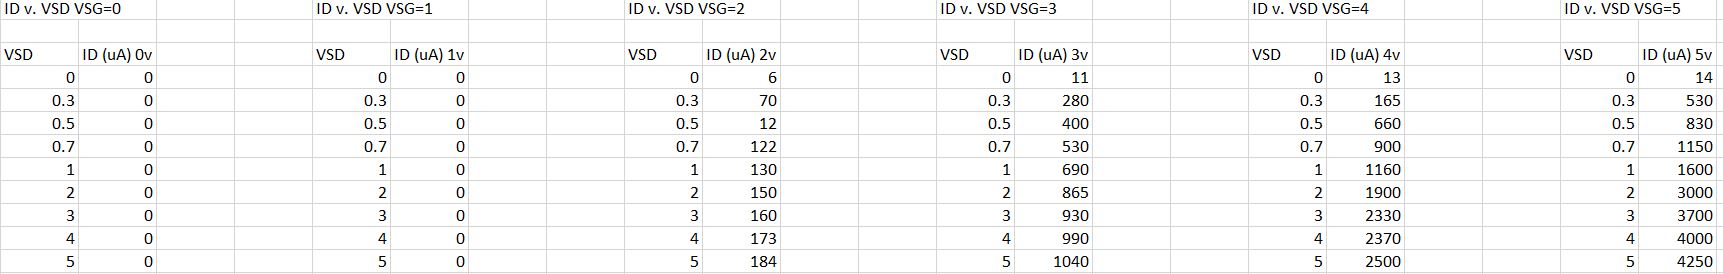
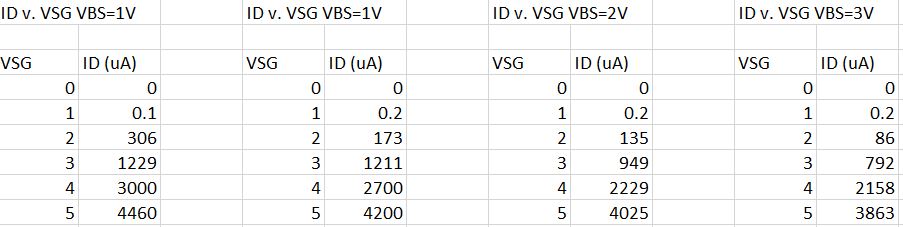
The plots below are gnerated by using an ammeter to test current tt different VGS or VDS voltages and then plotted in excel.
1) ID V. VSG (0 < VSG < 3V) with DSD = 3V

ID V. VGS | 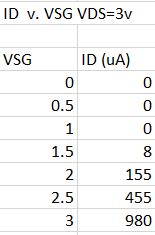
Data |
2) ID v. VSD (0 < VSD < 5V) for VSG varying from 1 to 5 V in 1V steps
3) ID v. VSG (0 < VGS < 5V) with VDS= 5V for VSB varying from 0 to 3 volts
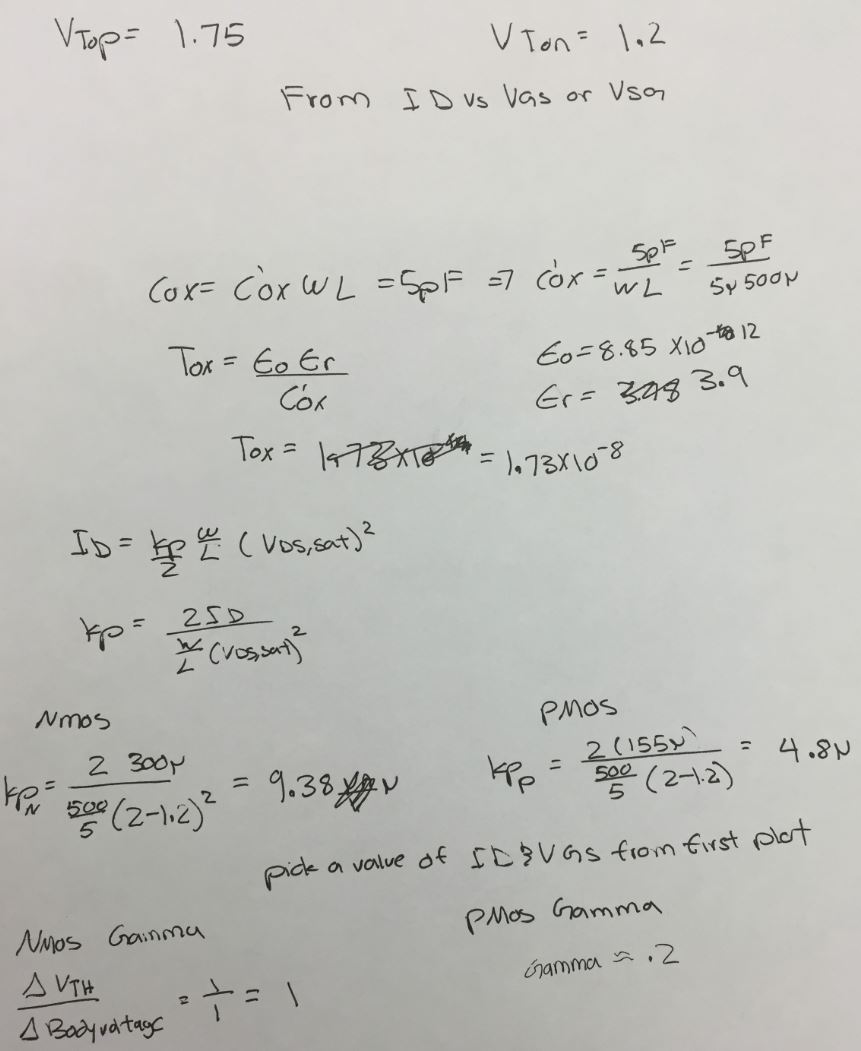
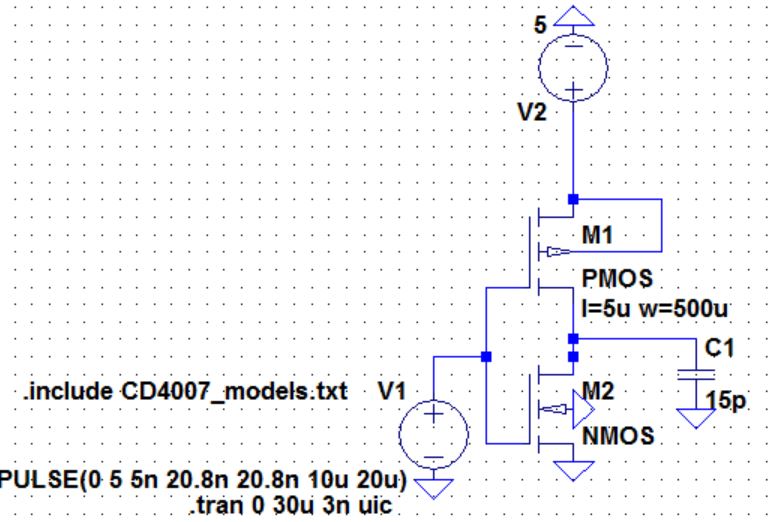
LTSPICE stimulations
The parameters and calculations for the MOSFETs are shown below and the file for the models is here
NMOS simulations
ID v. VGS (0 < VGS < 3 V) with VDS = 3 V 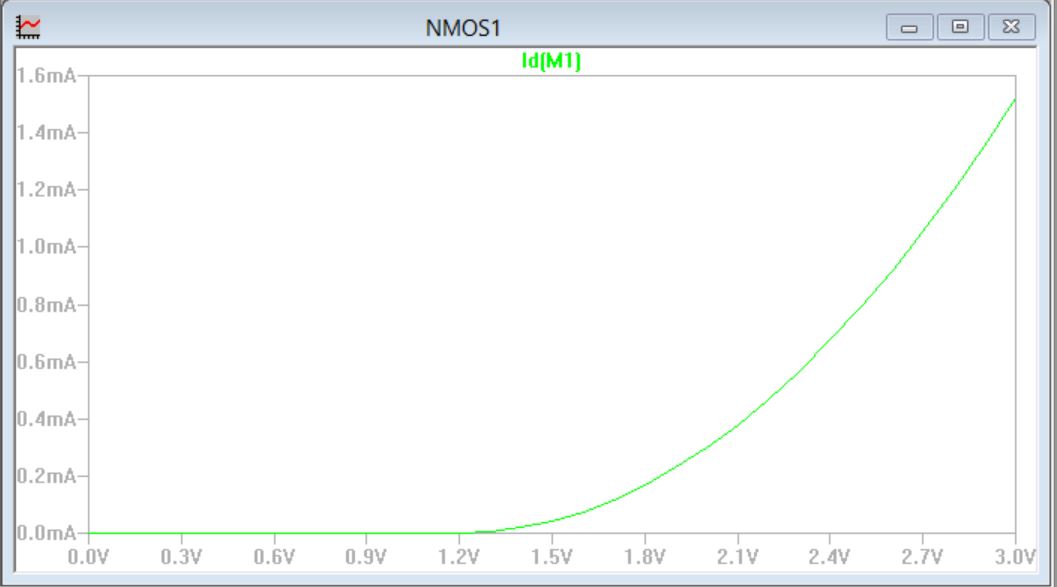
ID v. VDS (0 < VDS < 5 V) for VGS varying from 1 to 5 V in 1 V steps 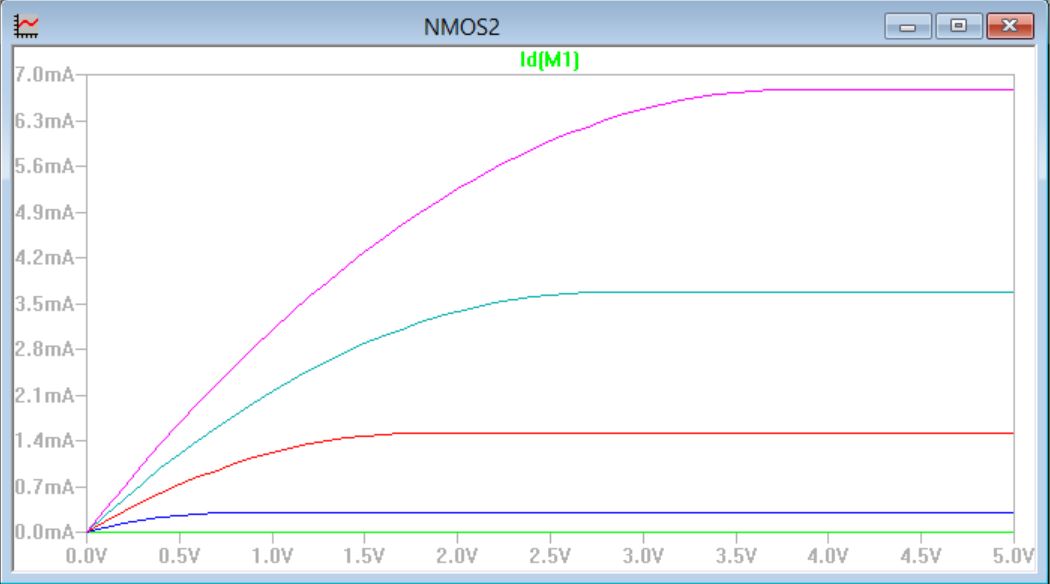
ID v. VGS (0 < VGS < 5 V) with VDS = 5 V for VSB varying from 0 to 3 V in 1 V

PMOS simulations
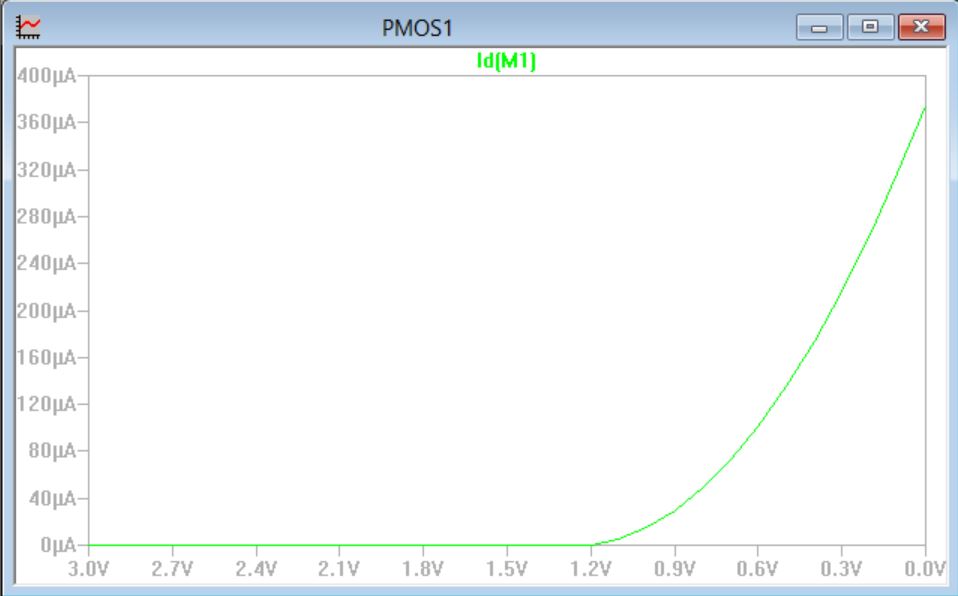
1) ID V. VSG (0 < VSG < 3V) with DSD = 3V
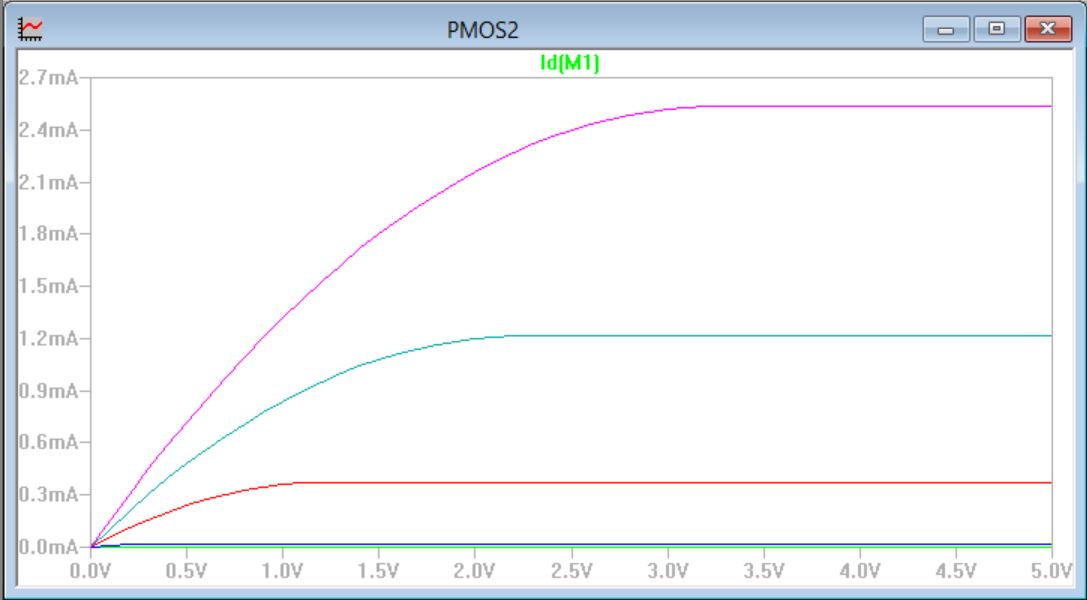
2) ID v. VSD (0 < VSD < 5V) for VSG varying from 1 to 5 V in 1V steps
3) ID v. VSG (0 < VGS < 5V) with VDS= 5V for VSB varying from 0 to 3 volts
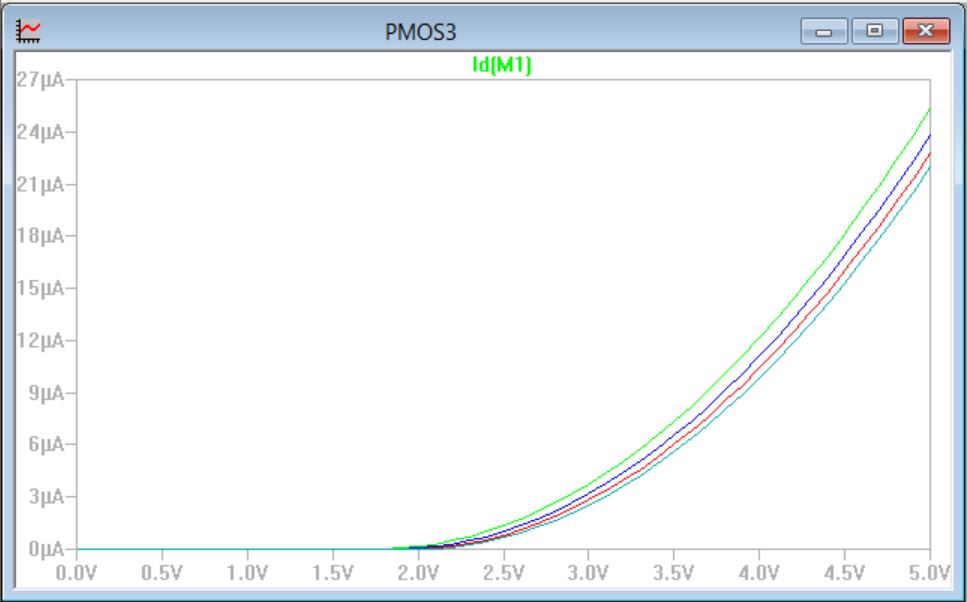
From
the simulatinos above and the experimental results, we can see that the
spice models match closely to our LTspice simulations.
Delay of an inverter
There
is already an inverter build in on the chip, we just had to connect the
input ,VDD and ground. The schmatic for an inverter is shown below
along with the response of the inverter to an input square wave.
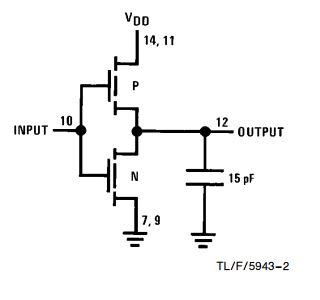
Schmatic of inverter | 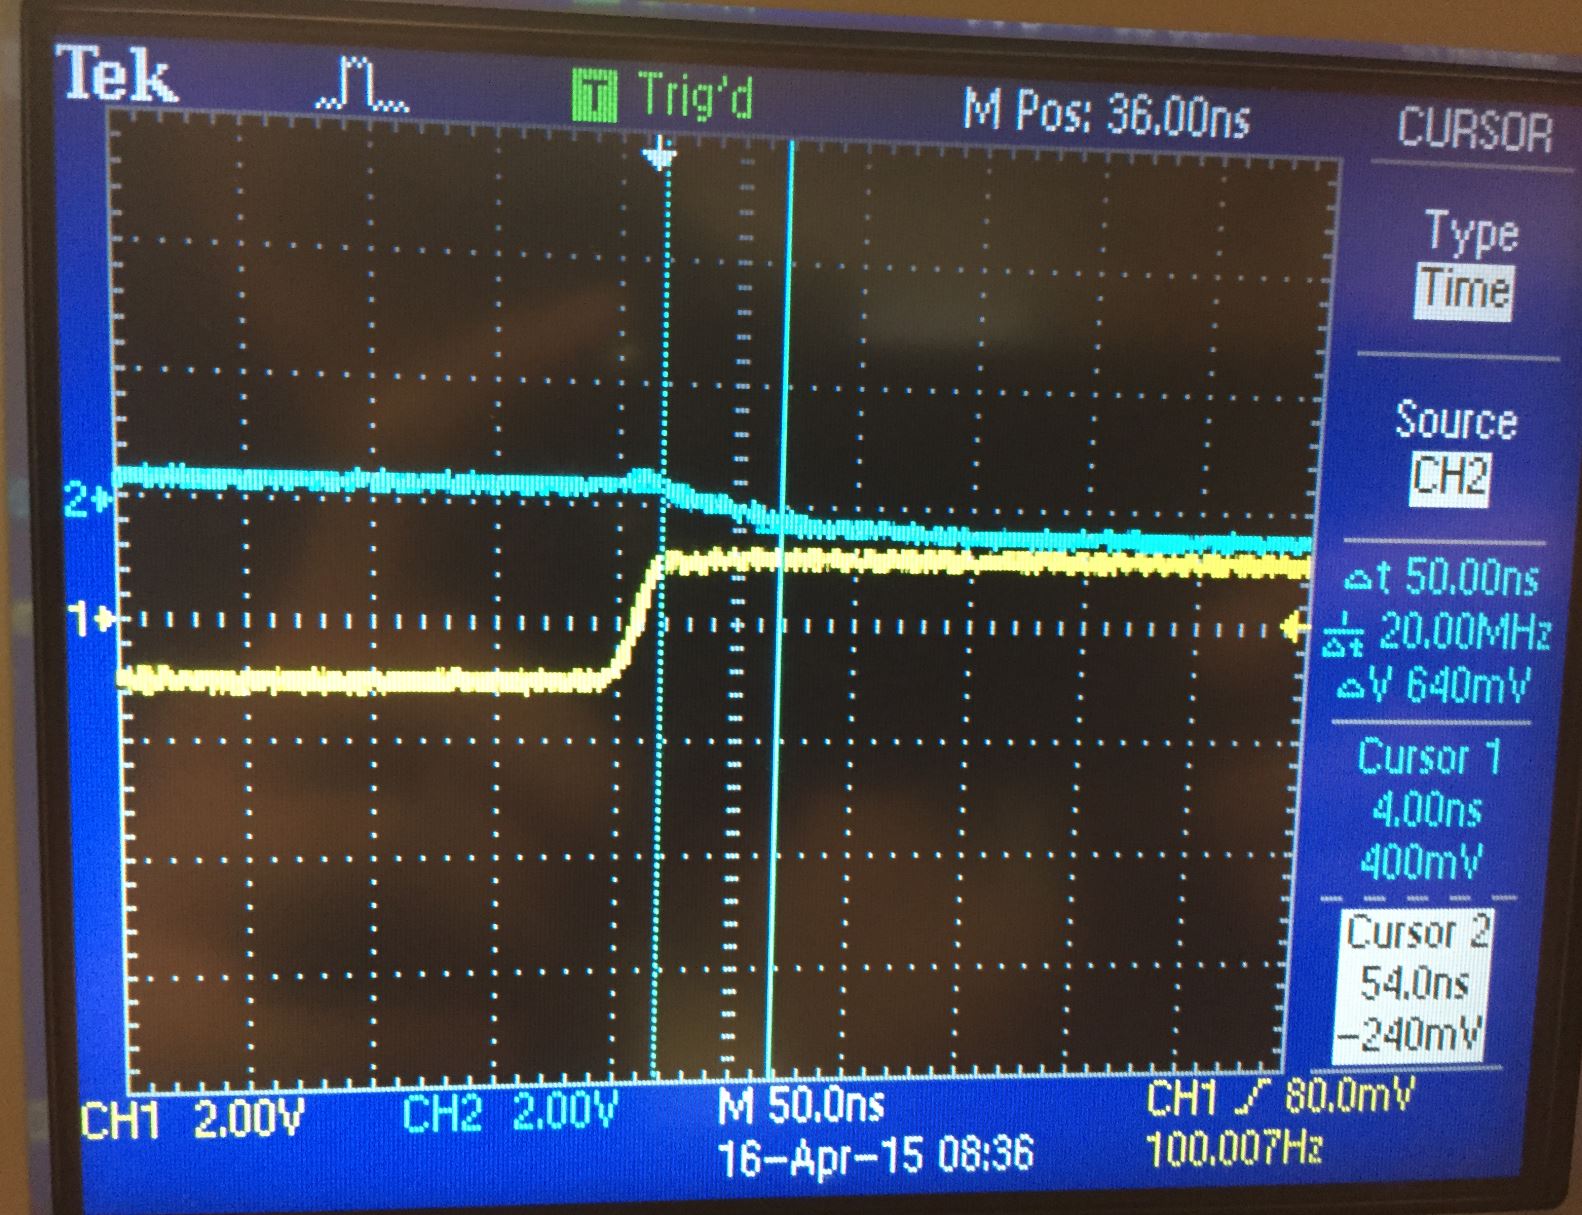
input/output of inverter with square wave input |
From
the oscilloscope picture, the yellow signal is the input and the blue
signal is the output. We can see that from the time the input signal is
100% high, it takes the output signal about 50 ns to be fully low (this
is an inverter so when the input is high, the output should be low).
This means that the inverter has a 50 ns delay.
Add
a return to the listing of your labs


