Lab 4 - ECE 420L
Authored
by: Justin Le
February 27, 2015
Goal
Measure the bandwidth and slew rate of the LM324 op-amp in various configurations.
Pre-Lab
Review the second video lecture and notes on op-amps.
Vary the parameters in the simulation from the lecture to ensure understanding of the circuit.
Experiment 1
The
non-inverting op-amp circuits in Figures 1a, 1b, and 3c were built,
using VCC+ = 5 V and VCC– = 0 V, to order to demonstrate how the
op-amp’s bandwidth varies with closed-loop gain. A common-mode voltage
of 2.5 is maintained by a voltage divider at the supply voltage node.
Figures 1d, 1e, and 1f show the 3-dB frequencies to be about 522 kHz,
106 kHz, and 40 kHz, respectively, which match the frequencies
corresponding to gains of 0 dB, 14 dB, and 20 dB in the frequency
response plot shown in Figure 1g. Although the measured amplitudes and
frequencies do not deviate from the estimated values, an undesired
phase-shift is present in the output that is possibly caused by the
internal capacitances of the op-amp.
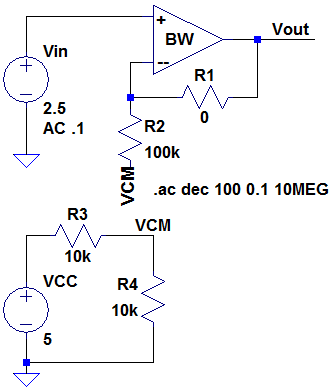
Figure 1a.
| 
Figure 1b.
| 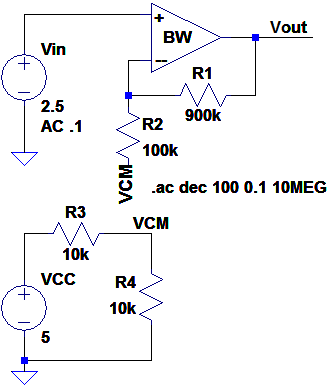
Figure 1c.
|
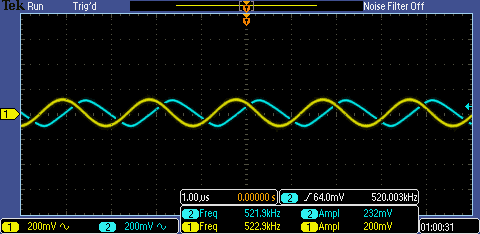
Figure 1d.
| 
Figure 1e.
| 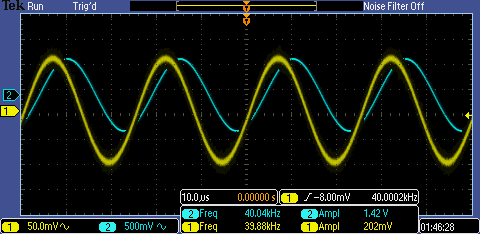
Figure 1f. |
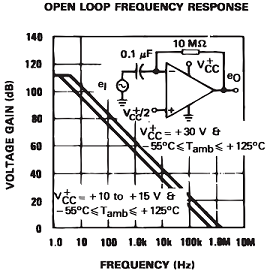
Figure 1g.
|
Experiment 2
Experiment
1 was repeated using the inverting op-amp circuits in Figures 2a, 2b,
and 2c, which have closed-loop gains of -1, -5, and -10, respectively.
The resulting 3-dB frequencies were about 650 kHz, 87 kHz, and 39 kHz,
as shown in Figures 2d, 2e, and 2f, which match the frequencies
corresponding to gains of 0 dB, 14 dB, and 20 dB in the frequency
response plot shown in Figure 1g.
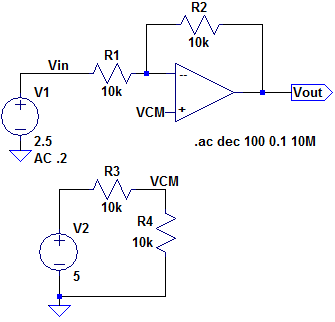
Figure 2a.
| 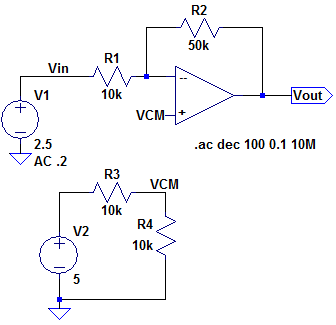
Figure 2b.
| 
Figure 2c.
|

Figure 2d.
| 
Figure 2e.
| 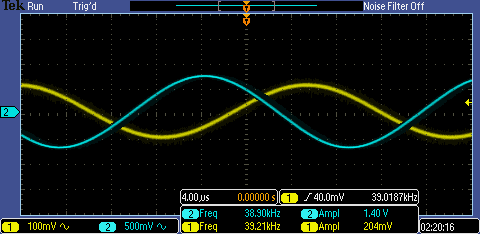
Figure 2f. |
Experiment 3
The circuit in Figure 2a was built, using VCC+ = 5 V and VCC– = 0 V, to measure the op-amp’s slew rate.
With
a sinusoidal input of amplitude 1.15 V and frequency 1.25 MHz, the
output slewed significantly, taking 265.2 ns to rise 184 mV, as shown
in Figure 3a. The slew rate is thus Vo / t = 184 mV / 265.2 ns = 0.694
V/µs, which approximates the value of 0.4 V/µs listed in the datasheet,
as shown in Figure 3c.
With a square-wave input of
amplitude 300 mV and frequency 420 kHz, the output slewed
significantly, taking 876.1 ns to rise 452 mV, as shown in Figure 3b.
The slew rate is thus Vo / t = 452 mV / 876.1 ns = 0.516 V/µs, which
approximates the value of 0.4 V/µs listed in the datasheet, as shown in
Figure 3c. In this case, the mismatch between the measured and
specified values can possibly be attributed to error in the scope's
precision in measuring voltage or time.

Figure 3a.
| 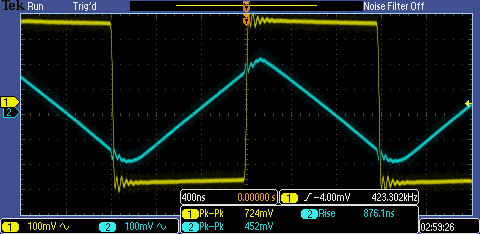
Figure 3b.
|

Figure 3c.
|
Figures
For Experiment 1:
abc: Schematics.
def: Measurements.
g: Datasheet.
For Experiment 2:
abc: Schematics.
def: Measurements.
For Experiment 3:
ab: Measurements.
c: Datasheet.
Click to view all labs.